Download
1 / 40
400 likes | 425 Views
This talk discusses the use of structure similarity, sequence similarity, and DNA-protein interaction patterns in functional annotation of proteins with known structure. Case studies include predicting calcium binding in AcetylcholineEsterase, classification of DNA-binding protein domains, and extending Gene Ontology annotation.

E N D
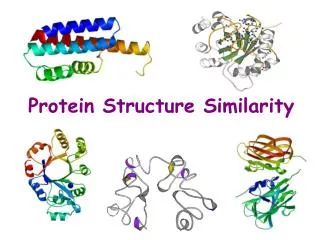
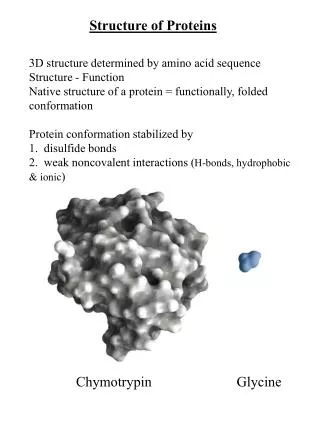
Functional Annotation of Proteins with Known Structure by Structure and Sequence Similarity, DNA-protein Interaction Patterns and GO Framework Ilya Shindyalov, UCSD/SDSC PhD, Group Leader, Protein Science Research DIMACS 2005-06-13
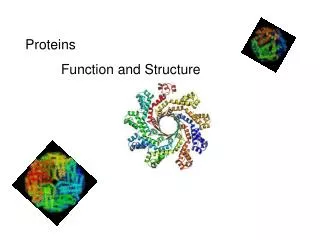
Essential Dataflow in ProteinScience Protein Data: Structure Sequence Function • Structure similarity: • DALI, • VAST, • CE • … • Sequence similarity: • BLAST, • fold recognition, • homology modeling • … Methods: Results:
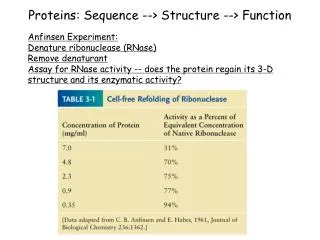
Do we know the function, if we know the structure? COVERAGE RATIO FOR FUNCTIONAL ANNOTATION Disease Biological Cell Molecular Process Component Function PDB STRUCTURES 0.758 0.396 0.371 0.335 SG TARGETS 0.355 0.315 0.452 0.259 PDB+SG 0.822 0.528 0.593 0.477 HOMOLOGY MODELS 0.984 0.792 0.839 0.821
The Subjects of my Talk 3 Approaches of Using Structure Similarity to Infer Protein Function: #1: Assigning function from known to unknown – CASE STUDY – Prediction of calcium binding in AcetylcholineEsterase – Projection on SNP responsible for Autism. #2: Classification of DNA-binding protein domains involving (in addition to structure similarity) – DNA-protein interaction patterns and sequence similarity. #3: Extending GO annotation using structure similarity – how reliable it can be? #4 [BONUS]: Why ontology is so important for humans?
#1: Assigning function from known to unknown – CASE STUDY – Prediction of calcium binding in AcetylcholineEsterase – Projection on SNP responsible for Autism. #2: Classification of DNA-binding protein domains involving (in addition to structure similarity) – DNA-protein interaction patterns and sequence similarity. #3: Extending GO annotation using structure similarity – how reliable it can be? #4 [BONUS]: Why ontology is so important for humans?
CE Protein structure comparison by Combinatorial Extension of the optimal path (Shindyalov and Bourne, 1998). http://cl.sdsc.edu
AFP = Aligned Fragment Pair Distance between two fragments AFP2 AFP1 Protein A ProteinA Protein B Protein B Alignment Path Protein A Protein A Protein B Protein B CE Step 1. Heuristic search for initial path.
CE Step 2. Iterative dynamic programming on starting superposition from step 1.
CE vs. other Algorithms ??? Novotny, M., Madsen, D., and Kleywegt, G.J. 2004. Evaluation of protein fold comparison servers. Proteins 54: 260-270.
Acetylcholinestarase vs. Troponin C 2ACE vs. 1TN4: RMSD = 4.6Å Z-score = 4.6 LALI = 86 LGAP = 8 Seq. Identity = 3.5%
#1: Assigning function from known to unknown – CASE STUDY – Prediction of calcium binding in AcetylcholineEsterase – Projection on SNP responsible for Autism. #2: Classification of DNA-binding protein domains involving (in addition to structure similarity) – DNA-protein interaction patterns and sequence similarity. #3: Extending GO annotation using structure similarity – how reliable it can be? #4 [BONUS]: Why ontology is so important for humans?
Data and algorithms used: • PDB - Protein Data Bank of February 13, 2002 with 17,304 entries was used as the source of original structural data. • - The DNA fragment size is at least 5 bp long. • At least 5 different protein residues are involved in the interaction with DNA. • - The contact distance cutoff between interacting atoms was < 5Å. • - We did not take into account the different types of DNA (A, B, Z) because of the insufficient level of this annotation in the PDB • PDP – Protein Domain Parser (Alexandrov, Shindyalov, Bioinformatics, submitted) • CE – Protein structure alignment by Combinatorial Extension (Shindyalov, Bourne, 1998) • SCOP - Structure Classification of Proteins (Murzin et al., 1995)
Building representative set of domains: PDB Selection of DNA-binding protein chains by analyzing DNA-protein contacts Parsing of DNA-binding protein chains into domains using PDP Selection of DNA-binding protein domains by analyzing DNA-protein contacts All-against-all structural alignment of DNA-binding protein domains using CE Selection of representative (non-redundant) set of DNA-binding protein domains Calculating classification of DNA-binding protein domains
Parameters measuring structural similarity: • Rmsd, root mean squared deviation between two aligned and compared protein domains> 2.0 Å; • Z-score, statistical score obtained from CE is < 4.5; • Rnar, ratio of the number of aligned residues to the smallest domain length< 90%; • Note: sequence identity in the alignment < 90%;
Parameters measuring structural similarity:Rmsd, Z-score, Rnar; • (2) Parameter measuring the match between DNA-protein contact patterns, Rmat; • A and B - DNA-protein domain complexes; • Rmat = min{RmatA, RmatB} • RmatX - ratio of the number of matched residues to the total number of residues involved in contacts with DNA in the DNA-protein complex X. Figure 2. Determination of matched protein-DNA contact pattern for two hypothetical DNA-protein domain complexes A and B structurally aligned to each other. All residues except those matched to “-“ are considered aligned to each other. Stars denote residues involved in protein-DNA interactions. Vertical bars denote matched protein residues involved in interaction with DNA.
Realignment using scoring function taking into account structural similarity between two protein domains and protein-DNA contact pattern Structure similarity term: Protein-DNA contact pattern term: where m – denotes protein residue, X – protein-DNA complex; C3is a scaling constant;
If Rmsd > 5.0 Å or Rnar < 70% or Z-score < 3.5, then domains are not considered as similar; • If Rmsd 3.0 Å and Rnar 80%, then domains are considered as similar; • If Rmat Rmatthreshold and either: 3.0 Å < Rmsd 5.0 Å andRnar 70% or 70% Rnar < 80% and Rmsd 5.0 Å, then domains are considered similar;
Comparison of the classification for all 338 DNA-binding domain representatives with SCOP at various threshold parameters
Final classification of DNA-binding protein domains (fragment):
Rnar Not similar Similar 80 Similar if Rmat<80 70 Not similar Rmsd 3 5
SPDC – Structural Protein Domain Сlassification http://spdc.sdsc.edu
#1: Assigning function from known to unknown – CASE STUDY – Prediction of calcium binding in AcetylcholineEsterase – Projection on SNP responsible for Autism. #2: Classification of DNA-binding protein domains involving (in addition to structure similarity) – DNA-protein interaction patterns and sequence similarity. #3: Extending GO annotation using structure similarity – how reliable it can be? #4 [BONUS]: Why ontology is so important for humans?
Why do we need the ontology? • Quantitative data explosion (e.g. exponential growth of sequence data - doubling every 7 month) • Qualitative data explosion (new experimental methods and new kinds of data appear, e.g. micro-arrays, interfering-RNA). • Lack of adequate means for information storage and exchange between: • - scientists, • - computers, • - scientists and computers (what’s published in scientific journals is de facto not reaching the community).
GO can serve as a language which can be easily read by both humans and computers. By using GO we ultimately learn to talk in one universal language. The goal of this work is to further realize the potential of GO.
CAR “part-of” “is-a” “has-a” Wheel BMW • What is GO? • Controlled dictionaries for: • - Molecular Function • Biological Process • Cellular Component • Acyclic graph • “is-a”, “part-of” (“has-a”) relationships
The GO Annotation (GOA) resources providing annotation of gene products with GO terms The IEA code, Inferred from Electronic Annotation, this means no human involvement in the assignment
Extending GO annotation of PDB chains using structural and sequence similarity 34,698 protein chainswere taken from the PDB of February, 2003 with the exception of theoretical models, short chains (less than 30 Cα atoms), and chains which don’t form domains (no domains detected by PDP algorithm). GO annotation has been assigned for 25,835 PDB protein chains by EBI from 34,698. Rmsd,root mean squared deviation between two structurally aligned polypeptides, it characterizes distances between C , C and mainchain O atoms of aligned residues. Z-score,statistically founded score, it characterizes significance of the alignment. Rnar,ratio of the number of aligned residues to the length of the shortest polypeptide, it measures overlap between aligned polypeptides. Rseq,sequence identity calculated for the structurally aligned residues.
For two polypeptides A and B with all calculated parameter values (Rmsd, Z-score, Rnar,Rseq) and given threshold values (Rmsdthreshold, Z-scorethreshold, Rnarthreshold,Rseqthreshold) we define: SSCAB=(Rmsd<Rmsdthreshold ) (Z-score>Z-scorethreshold) (Rnar>Rnarthreshold) (Rseq>Rseqthreshold) - denotes logical AND. SSCAB can only be ascribed two values: true or false. If SSCAB is true, then A and B are similar. If SSCAB is false, then A and B are not similar. The chains were clustered such that for every two chains in each cluster the above condition (in red) holds true.
Specificity Criteria: • For the clusters where GO terms were available for at least two chains we define: • “positive cluster” - where all chains have the same GO terms; • “negative cluster” - where chains have different GO terms (more specific definitions for three criteria will be given further); • TP (true positives) - a number of chains with GO terms in the positive clusters; • FP (false positives) - a number of chains with GO terms in the positive clusters; • ppv (positive predictive value) or specificityis the following ratio - TP/(TP+FP)
Specificity Criteria (cont.): {ti1,..tik(i)} - is a set of GO terms k(i) for i-th chain. Each specificity is defined for a clusters with at least two annotated chains. Specificity-1 (the most rigorous) - “positive” cluster must have every pair of chains (i, j) with the same set of GO terms: tin = tjn , n=1,…k(i), k(i)=k(j), for (i, j), i{1,…N}, j{1,…N}. Specificity-2(less rigorous than specificity-1)- “positive” cluster must have for every pair of chains (i, j) with different number of GO terms the following: for the chain with a smaller number of terms – all terms must be present amongst the terms for a chain with a larger number of GO terms: {ti1,..tik(i)} {tj1,..tjk(j)}, if k(i) k(j);i{1,…N}, j{1,…N}; {t1,..tN}. Specificity-3(less rigorous than specificity-2) - “positive” cluster must have a common set of terms {t1,..tL} for all N chains within the cluster: {t1,..tN} {ti1,..tik(i)}, i=1,…N; {t1,..tN}. Further detailing of specificity (Specificity-4) should involve the semantic distance (e.g. Lord et al, 2003) between terms in judging cluster to be “positive”.
Clusterization of PDB chains and the accuracy of GO annotation at different threshold values of structural similarity parameters.
Assignment of GO annotation with structural similarity parameters (Rmsd 5.0Å, Z-score 3.8, Rnar 70%, Rseq 90%). Red dot denotes newly annotated chains, red arrow denotes new “GO term – chain” associations assigned for newly annotated chains. Purple line denotes new “GO term – chain” associations assigned for chainspreviously annotated (by EBI). Black arrow denotes existing “GO term – chain” associations assigned by EBI.
The example of “negative” cluster by the definition of specificity-1 and “positive” cluster by the definitions of specificity-2 and specificity-3. Seven GO terms could be assigned to chains 1h9dA, 1h9dC (Rmsd 5.0Å, Z-score 3.8, Rnar 70%, Rseq 90%). 1e50A (7) 3677, 3700, 5524, 5634, 6355, 7275, 8151, 1e50C (7) 3677, 3700, 5524, 5634, 6355, 7275, 8151, 1e50E (7) 3677, 3700, 5524, 5634, 6355, 7275, 8151, 1e50G (7) 3677, 3700, 5524, 5634, 6355, 7275, 8151, 1e50Q (7) 3677, 3700, 5524, 5634, 6355, 7275, 8151, 1e50R (7) 3677, 3700, 5524, 5634, 6355, 7275, 8151, 1cmoA (7) 3677, 3700, 5524, 5634, 6355, 7275, 8151, 1co1A (7) 3677, 3700, 5524, 5634, 6355, 7275, 8151, 1ljmA (7) 3677, 3700, 5524, 5634, 6355, 7275, 8151, 1ljmB (7) 3677, 3700, 5524, 5634, 6355, 7275, 8151, 1hjbC (4) 3677, 5524, 5634, 6355, 1hjbF (4) 3677, 5524, 5634, 6355, 1hjcA (4) 3677, 5524, 5634, 6355, 1hjcD (4) 3677, 5524, 5634, 6355, 1io4C (4) 3677, 5524, 5634, 6355, 1eanA (4) 3677, 5524, 5634, 6355, 1eaoA (4) 3677, 5524, 5634, 6355, 1eaoB (4) 3677, 5524, 5634, 6355, 1eaqA (4) 3677, 5524, 5634, 6355, 1eaqB (4) 3677, 5524, 5634, 6355, 1h9dA no go terms 1h9dC no go terms 3677 (F) - DNA binding 3700 (F) - transcription factor activity 5524 (F) - ATP binding 5634 (C) - nucleus 6355 (P) - regulation of transcription, DNA-dependent 7275 (P) - development 8151 (P) - cell growth and/or maintenance The cluster of the same proteins which is Runt-related transcription factor 1 (synonyms: core-binding factor alfa subunit, acute myeloid leukemia 1 protein etc.).
The example of “positive” cluster by definition of specificity-1. Phospholipase A2. 1cl5A (5) 4623, 5509, 15070, 16042, 16787, 1cl5B (5) 4623, 5509, 15070, 16042, 16787, 1fb2A (5) 4623, 5509, 15070, 16042, 16787, 1fb2B (5) 4623, 5509, 15070, 16042, 16787, 1fv0A (5) 4623, 5509, 15070, 16042, 16787, 1fv0B (5) 4623, 5509, 15070, 16042, 16787, 1jq8A (5) 4623, 5509, 15070, 16042, 16787, 1jq8B (5) 4623, 5509, 15070, 16042, 16787, 1jq9A (5) 4623, 5509, 15070, 16042, 16787, 1jq9B (5) 4623, 5509, 15070, 16042, 16787, 1kpmB no go terms 4623 (F) - phospholipase A2 activity 5509 (F) - calcium ion binding 15070 (F) - toxin activity 16042 (P) - lipid catabolism 16787 (F) - hydrolase activity
Only four “negative” clusters have occurred by definition of specificity-3: An example of missed GO terms for 2mtaC and other chains of Cytochrome c-L (cytochrome c551i) 2mtaC (3) 5489, 6118, 15945 1mg2D (2) 16021, 16032, 1mg2H (2) 16021, 16032, 1mg2L (2) 16021, 16032, 1mg2P (2) 16021, 16032, 1mg3D (2) 16021, 16032, 1mg3H (2) 16021, 16032, 1mg3L (2) 16021, 16032, 1mg3P (2) 16021, 16032, 5489 (F) - electron transporter activity 6118 (P) - electron transport 15945 (P) - methanol metabolism 16021 (C) - integral to membrane 16032 (P) - viral life cycle
#1: Assigning function from known to unknown – CASE STUDY – Prediction of calcium binding in AcetylcholineEsterase – Projection on SNP responsible for Autism. #2: Classification of DNA-binding protein domains involving (in addition to structure similarity) – DNA-protein interaction patterns and sequence similarity. #3: Extending GO annotation using structure similarity – how reliable it can be? #4 [BONUS]: Why ontology is so important for humans?
Evolution of complex systems: Computers: complexity doubles in every 18 month per $$$ (Moore’s Law) Human Brain: very slow (complexity doubles in ~100,000 years) Complexity = Speed x Memory Computer = 5TB x 256 GFLOP = 1024 memory FLOPs Brain = 1137TB x 4.4 TFLOP = 5x1027 memory FLOPs Brain/Computer=5x103 or 3.7 log units Moore’s Law: 3.5 years/log unit Human brain capacity for computers will be reached: 2000+3.7x3.5=2013 Based on (Ramsey, 1997)
The accuracy of predicting the future for the next 2 years equals 10%
Credits: Julia Ponomarenko (she did #2 and #3) Phil Bourne (discussions, conceptualizations, logistics) Lei Xie (PDB statistics) NIH Grant GM63208 NSF Grants DBI 9808706, DBI 0111710 Gift from Ceres Inc.