Download
1 / 33
330 likes | 341 Views
Research in Psychology. Psychology is defined as the scientific study of ……. Introducing Research. 1. What does it mean to say that someone has a scientific attitude? What do you think is the key distinction between a correlational study and an experiment?

E N D
Research in Psychology Psychology is defined as the scientific study of ……
Introducing Research 1. What does it mean to say that someone has a scientific attitude? • What do you think is the key distinction between a correlational study and an experiment? 3. Identify three types of correlational studies and provide some strengths and weaknesses of each. 4. What role might confounding variables play in an experimental study? Provide some examples. 5. What role do controls play in a research study? (Provide some examples.)
Types of Research • Applied Research: Practical application.. • Clinical Research: Patient oriented.. • Basic Research: Expand knowledge, no practical app
Why do we need research? The Dangers of Common Sense • Hindsight Bias or “I-knew-it-all-along” • people tend to view events as more predictable than they really were. • Intuition : • sensing without the use of rational process • False Consensus effect – tendency to overestimate others’ agreement with us
Overconfidence Confidence level: not a consistent predictor of accuracy (We tend to remember our correct predictions and disregard our wrong ones!)
Research Strategies theories lead to generate or refine research and observations hypothesis • Theory • an explanation that organizes and predicts observations • Hypothesis (If…, then…) • a testable prediction often implied by a theory • Operational Definitions • the specific procedures or steps used in the research study
Scientific Method State the Problem Gather Information Form a Hypothesis Test the Hypothesis Record and Analyze Data State the Conclusion Repeat the Work
Types of ResearchCorrelational Studies • Explores strength of a relationship between two or more variables • Can make predictions, but cannot explain cause and effect
Types of Correlational Studies Case Study • In-depth study- one person / small group • Strength: provides valuable insight on an issue / condition • Weakness: findings can rarely be generalized to a population • Some exceptions…(Phineas Gage)
Correlational Studies…. Survey Method • research the self-reported attitudes or behaviors of people • Questionnaire / Survey / interview... • Strength: can be generalized to a larger population (if sample is random) • Weakness: No cause and effect • Wording of survey can introduce bias
Correlational Methods Random Samples Random Sample – when every person in targeted population has equal chance of participating. The larger the sample size the more likely to represent the whole Ex. Computer generated list of every 5th person. Why not send survey the entire school?
Correlational Methods Naturalistic Observation Observing subjects in natural habitats / no interaction between researcher and subjects Strength: valuable insight into natural behavior Weakness: no cause and effect
Bias in Naturalistic Observation • Observer Effect: Behavior can change when being watched… (animals or humans) • Observer Bias: • When researchers notice what they want to see and ignore what doesn’t support their theory • Anthropomorphic Fallacy: Attributing human thoughts, feelings, or motives to animals during research (especially when explaining behavior)
Bias in research… Experimenter Effects: Changes in behavior caused by the unintended influence of the experimenter Self-Fulfilling Prophecy: When expectations affect outcome… (teachers..) Hawthorne Effect: subjects perception of experiment alters their performance...
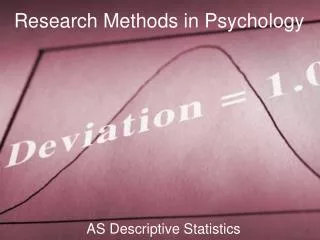
Correlational Research Analyzing Data Correlation Coefficient: measures the strength of a relationship. A Positive correlation: presence of one thing predicts the presence of the other thing. (2 sets of scores rise or fall together: +1=perfect correlation) A Negative correlation means the presence of one thing predicts the absence of the other thing. (one goes up, the other down: ---1= perfect negative 0 – no correlation
Correlations: Statistical Analysis • Scatterplot (aka scattergram, scatter diagram) • Graphed data that shows the strength of a correlation • The more the data forms a line, the stronger the correlation, IOW: • little scatter indicates high correlation • extensive scatter = little or no correlation • the slope of the line suggests a positive or negative correlation
Research Methods Perfect positive correlation (+1.00) No relationship (0.00) Perfect negative correlation (-1.00)
Fig. 1.9 The relationship between years of college completed and personal income (hypothetical data).
Research Strategies 95 90 85 80 75 70 65 60 55 50 45 40 35 30 25 Temperament scores Height in inches 55 60 65 70 75 80 85 Scatter plot of Height and Temperament
Remember… Correlations do not prove causation. Correlations only make predictions about the relationship between two variables Example: There is a positive correlation between a child watching violent TV and that child displaying violent behavior. Why can we not claim that violent TV causes violent behavior?
So… • Correlation indicates the possibility of a cause-effect relationship, but it cannot prove causation
Illusionary Correlation • Illusionary Correlation – False assumption of relationship between two things (tend to recall instances that confirm our belief.) • Examples: • More babies born during a full moon, infertile couples who conceive after they adopt, premonition of a phone call followed by the phone call
Remember… • Correlational methods can be used in case studies, surveys, and field experiences.
Experimentation: Cause and Effect Experiment: the clearest way to isolate cause & effect Experiments manipulate variables to test the results
Know the Difference… Correlational studies uncover naturally occurring relationships. experiments manipulates a setting to determine its effect.
Key Experimental Principles Experimental group – Group that receives the treatment Control group – Group that does not receive the treatment (placebo) Each group must be from a random sample, and randomly assigned
Variables (Anything that can vary…) • Independent Variable (IV) • the variable that is manipulated (example, the drug) • Dependent Variable (DV) • the variable that is measured (example: behavior, or memory)
….Variables Determine the IV and DV in the following hypothesis: • If you give a child sugar, then the child’s activity level increases.
Confounding Variables • Inconsistencies between experimental and control groups that can skew the results (bias!) • Examples: Time, place, frequency, amount etc.
…Confounding Variables • If you give a child sugar, then the child’s activity level increases. • What confounding principles might affect this experiment? • Scheduled activities after the experiment • Location of observed behavior • Peer group during experiment • Size of peer group during experiment • Amount and type of sugar ingested • Time of the experiment • Conditions prior to the experiment
Controls (steps to avoid confounding variables) Placebos – “sugar pills” or any inert substance given to control group (used as comparative basis against the experimental group) Single blind procedure: Subjects don’t know which group they are in… Double-blind procedure – neither subjects nor experimenter know if subjects are in the experimental group or the control group Random sample and random assignment
Remember… • Experiments aim to manipulate an independentvariable, measure a dependent variable, and control all other variables.
Good Research is… Valid – when it measures what the researcher set out to measure and is accurate Reliable – when replication , with same operational definitions, results in the same outcome.