Download
1 / 21
210 likes | 225 Views
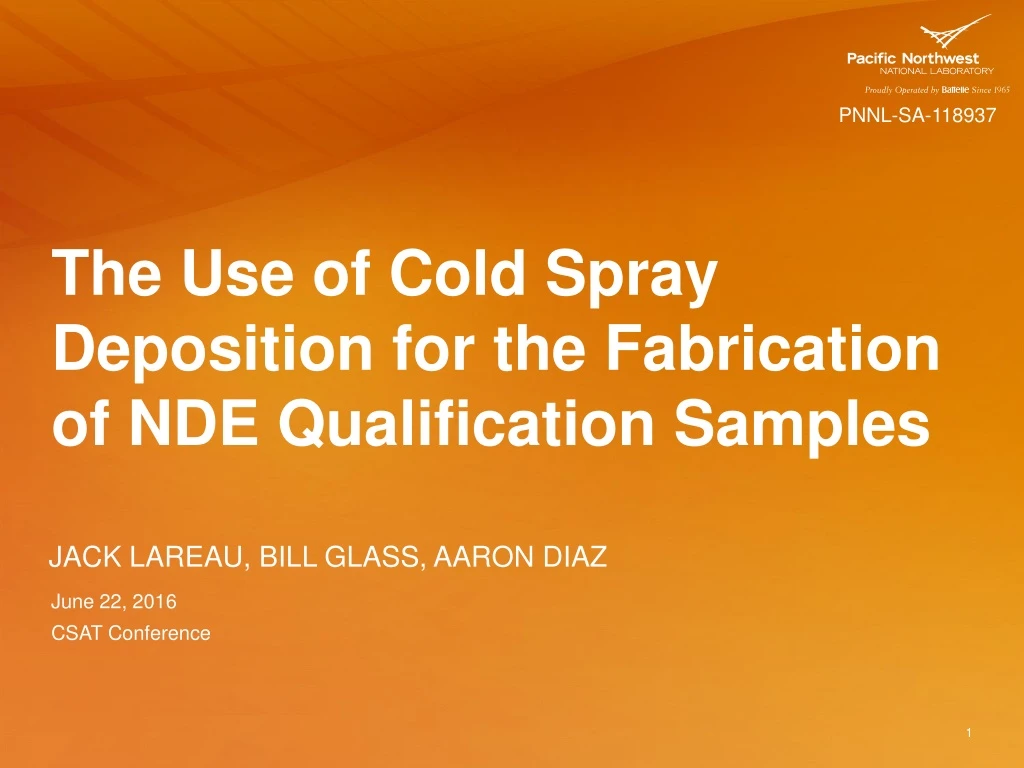
PNNL-SA-118937. The Use of Cold Spray Deposition for the Fabrication of NDE Qualification Samples. Jack Lareau, Bill Glass, Aaron Diaz. June 22, 2016. CSAT Conference. The Use of Cold Spray Deposition for the Fabrication of NDE Qualification Samples. Acknowledgments

E N D
PNNL-SA-118937 The Use of Cold Spray Deposition for the Fabrication of NDE Qualification Samples Jack Lareau, Bill Glass, Aaron Diaz June 22, 2016 CSAT Conference
The Use of Cold Spray Deposition for the Fabrication of NDE Qualification Samples • Acknowledgments • Vic Champagne, Army Research Lab, for support in obtaining samples • Aaron Nardi, United Technology Research Center, for performing the cold spray coatings • Mike Larche, Matt Prowant, and Ken Ross, Pacific Northwest National Laboratory, for technical support
Cold Spray NDE Samples • Nuclear power plant based emphasis • All NDE techniques require some level of Performance Demonstration using realistic flaw mockups (ASME Code and NRC requirements) • Current technology for mockup fabrication is limited to surface-connected flaws (simulated service-induced corrosion) • Welded implants of fatigue cracks • EDM notches that are squeezed closed using hot isostatic pressure (HIP) • Lab-grown stress corrosion cracks (SCC) • Undetected weld fabrication flaws are subsurface • Inclusions • Lack of fusion
False Positive UT Results • UT weld inspections rely on high sensitivity tip diffraction techniques • Often, small internal, benign reflectors are mistaken for crack tips resulting in alarming false positive crack calls • One instance misinterpreted data to show a 360-degree very deep crack • NRC issued potential shutdown orders for 12 operating plants • Industry impact was in the $100s M
Undetected Near Surface Flaws • Occasionally welding flaws exist in the near subsurface zone and are missed by the final penetrant testing (PT) • The remaining ligament can be ruptured over time by thermal and mechanical stresses • Exposing subsurface welding inclusions to high temperature water creates a highly caustic environment • Cracking has resulted in primary system leakage • Industry impact was in the $100s M
Cold Spray Mockups • The primary system pressure boundary in a nuclear plant is comprised of either stainless steel or high nickel alloy material • Coating powders selected were • 316 stainless steel • Inconel 625 (annealed and non-annealed) • Substrate was 304 SS • Samples were designed to • demonstrate the ability of UT to detect and distinguish subsurface flaws • demonstrate that eddy current testing (ET) could detect near subsurface flaws
316 SS Sample Top View: Three bands of thicknesses ranging from 0.7 to 1.5 mm nominally Side View: Two plates welded together with the seam simulating a subsurface flaw
316 SS Coating Tickness and Surface Contour (Ultrasonic Microscope)
Differential Probe (0.12” Footprint) 200 kHz Flaw Detection 400 kHz Flaw Detection
ET Observations • Small footprint probe used to accommodate actual part geometry • Larger probes do better for subsurface flaws • Objective of detecting planar flaws up to 1 mm below the surface was met • The cold spray 316 SS coating closely mimicked the ET properties of plate material for this application • Signal attenuation and phase delay provided an indirect measurement of apparent bulk conductivity • This was not the intent of this study and surface roughness was too high to make accurate quantitative measurements • Can we use ET measurement of “apparent conductivity” to assess coating quality?
ET “Spectroscopy” • Work performed at Wright-Paterson AFB addressed using ET to measure “apparent conductivity” at several test frequencies • Application was for residual stress measurements after peening in high Ni alloys • A similar approach is being studied to assess cold spray coating properties • This effort is just getting started • Alloys of interest are Inconel 625 and SS 316
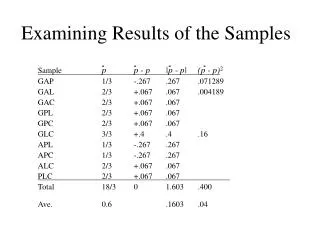
Conductivity Mosaic Absolute Pancake ET Probe • Data collected with 4 frequencies (1.5, 1.0, 0.75, & 0.5 MHz) • Balanced on Alloy 600 conductivity sample • Scan and index resolution of 0.050” I 600 I 750 SS 316 I 625 I 800 N 200 0.5” 5.5”
Absolute Pancake Data – Conductivity Mosaic • Sample Order from Left to Right: • Inconel 600 • Inconel 625 • Inconel X750 • Incoloy 800 • Incoloy 825 • Nickel 200
Inconel 625 Cold Spray Coating Scan • Data collected using same setup from conductivity mosaic • Scan dimensions: 5.0 x 2.4” 5.0” 2.4” Tape Edge Blue arrows indicate surface thickness changes that caused liftoff
UT Scanning Arrangement • Probe was placed on the smooth substrate surface • 45-degree shear wave and 60- degree longitudinal waves used • Coating surface contour satisfied ASME requirement for UT (<0.8 mm variation over 25 mm) • Due to relatively thin cross section, 5 MHz used
45 Degree Shear Wave Results 1 mm coating thickness: barely separable signals 0.5 mm coating thickness: no discrimination from backwall
45 Degree Shear Wave Results 1.5 mm coating thickness: clearly separable signals Conclusions • Subsurface determination is possible for ligaments with a minimum thickness somewhere between 1.0 and 1.5 mm • This corresponds to approximately 2 wavelengths • This result is wavelength dependent, so lower frequencies would require a correspondingly thicker ligament
60 Degree Longitudinal Wave Results 1.0 mm coating thickness: no discrimination from backwall 0.5 mm coating thickness: no discrimination from backwall
60 Degree Longitudinal Wave Results 1.5 mm coating thickness: slightly separated signals Conclusions • The longer wavelength of the longitudinal wave requires a greater ligament thickness for discrimination of subsurface flaws • For most actual field applications, a discrimination level of 2 mm would be adequate • Longitudinal waves are actually the preferred method for high alloy welds
Future Work with UT • Bond quality assessment will be investigated • Conventional high frequency 0 degree UT has been shown to be ineffective • Contaminants that cause weak bonds also act as ultrasonic couplant and transmits the sound • Alternate wave modes are being studied • Interface waves that are only produced at well bonded interfaces of similar metals • Layer modes (one free surface and one well bonded surface)