Download
1 / 34
340 likes | 341 Views
This study explores the factors influencing the export of biogenic particulates from the upper ocean through selected models. It examines the impact of primary production, ballasting agents, algal cells, food web structure, particle transformations, and microbial processes. The study also presents case studies examining the relationship between primary production, depth, and export, the effectiveness of J100 as a predictor of export, and the influence of different food web structures on export efficiency. The study concludes by discussing the need for additional factors in export models.

E N D
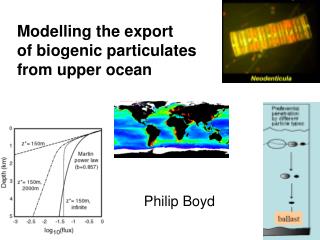
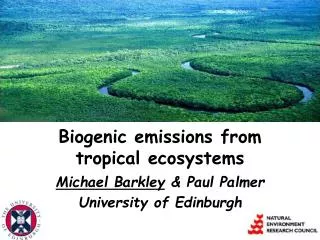
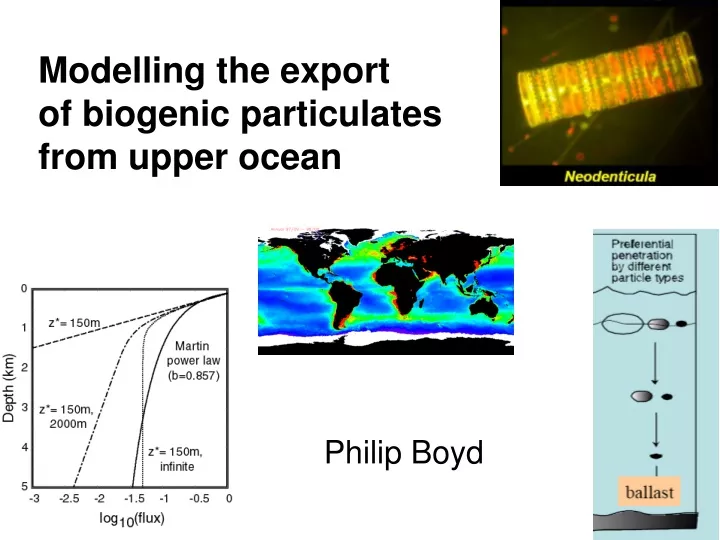
Modelling the export of biogenic particulates from upper ocean Philip Boyd
Behrenfeld (OSU)
Outline Factors impacting export – selected models • NPP and export (Suess, 1980) • J100 (Martin et al., 1987) • Algal cells and foodweb structure (Michaels & Silver, 1988); Boyd & Newton (1995) • NPP and temperature – Laws et al. 2000 • Ballasting agents (Armstrong et al. 2001) • Mechanistic models – (Dunne et al., 2005) • Summary
FACTORS CONTROLLING EXPORT Present status Primary Production Ballasting agents Algal cells – large versus small Particle transformations – aggregation Foodweb structure – different grazers Microbial processes - solubilisation
Case study 1 – Suess (1980) a direct relationship between NPP, depth and export
Case study 1 – Suess (1980) a direct relationship between NPP, depth and export
Case study 2 – replacing NPP with J100 (Martin et al., 1987)
What does J100 represent? Why is it a better predictor of export?
What does J100 represent? Why is it a better predictor of export?
Different foodweb structures result in A range of export efficiencies (pe ratio) pe ratio = particle export/NPP
1989 2.7 µg chla L-1 16.1 g C m-2 NPP -27 mmol NO3 m-2 32.0 µmol kg-1 tCO2 80% diatoms Microzoo grazing 1990 3.6 µg chla L-1 14.7 g C m-2 NPP -33.5 mmol NO3 m-2 -33.5 µmol kg-1 tCO2 70% diatoms Microzoo grazing Using Michaels & Silver-Comparison of NE Atlantic spring bloom signatures (Boyd & Newton, 1995)
1989 2.7 µg chla L-1 16.1 g C m-2 NPP -27 mmol NO3 m-2 32.0 µmol kg-1 tCO2 80% diatoms Microzoo grazing 720 mg POC m-2 export (3100 m) 1990 3.6 µg chla L-1 14.7 g C m-2 NPP -33.5 mmol NO3 m-2 -33.5 µmol kg-1 tCO2 70% diatoms Microzoo grazing 410 mg POC m-2 export (3100 m) Using Michaels & Silver-Comparison of NE Atlantic spring bloom signatures (Boyd & Newton, 1995)
Predicted 16.6 (Suess) 15.1 41.8 (Betzer) 36.7 19.2 (Berger) 17.5 4.4 (Pace) 4.0 9.5 (BN – Martin) 3.8 Observed 9.6 4.0 Observed versus predicted POC export(mg C m-2 d-1) (1989 – black; 1990 – red)
Case study 4 Laws et al. (2000) Temperature effects on export fluxes Calculated ef ratios (export/NPP) as a function of NPP and temperature Nutrients Filter feeder Carnivore Large PP Inorganic nutrients Detrital POC Flagellates Small PP Ciliates Export DOM Bacteria
0.7 0.7 Ross Sea * Ross Sea * Polyna * * Polyna NABE * NABE * Obs. ef ratio 0.4 * OSP 0.4 OSP * * Peru-normal Peru-normal * Peru El Nino * * Peru El Nino * Arabian * HOT HOT * * Arabian * EqPac * EqPac * BATS * BATS *EqPac-EN *EqPac-EN 0 0.6 500 1000 0 Modelled ef ratio NPP (mg N m-2 d-1)
Combining ef ratio with satellite NPP and SST – global export is 20% of NPP
Ballast revisited Non-selective preservation within the Inorganic matrix of biominerals Plankton - EqPac AA CARB LIPID Export 1000 m The mineral matrix Export 3500 m 8 nm Hedges et al. 2001 0 60 Weight %
Fluxes normalised to mass flux (OC/M) are much less variable than POC fluxes alone POC flux 0 S 5 S 5 Depth (km) S 5 EqPac 5 0 S 5 5 S 5 5 S Fraction OC by weight
POC export here is based on quantitative association of POC with ballast minerals Protected POC POC flux Dashed line = excess POC flux i.e. POC not associated with ballast minerals Martin curve “Using ballast mineral data markedly increases the ability to predict organic carbon fluxes”
Case study 6 Dunne et al. (2005) Empirical and mechanistic models for the pe ratio A synthesis of global field observations related to ecosystem size structure, NPP and particle export was used for model validation
Large phytoplankton augment small ones as production or biomass increases. In this model, variability in NPP results in a biomass-modulated switch between small and large phytoplankton pathways
The empirical model captures 61% of the observed variance in the pe ratio of particle export using SST and chlorophyll concentrations (or NPP) as predictor variables.
The empirical model captures 61% of the observed variance in the ratio of particle export to primary production (the pe ratio) using sea-surface temperature and chlorophyll concentrations (or primary productivity) as predictor variables.
SUMMARY (Boyd & Trull) Similarity of global export estimates despite the diversity of approaches. Either the problem has a relatively unique solution, or all models are making similar approximations. No models have yet included sufficient complexity to capture the observed variability of export fluxes. Determining which additional factors, beyond those of temperature, chlorophyll and NPP, are, most critical is a high priority task.
Observed versus predicted POC export (% error of fit – ((100*(predicted-observed)/(observed))