Download
1 / 21
220 likes | 227 Views
Upper and Deep Ocean 1). The base of thermocline at a depth of roughly 1 km represents the lower boundary of the domain of the vigorous ocean circulation driven by the wind stress and large-scale distribution of heating and cooling (~upper ocean)

E N D
Upper and Deep Ocean 1). The base of thermocline at a depth of roughly 1 km represents the lower boundary of the domain of the vigorous ocean circulation driven by the wind stress and large-scale distribution of heating and cooling (~upper ocean) 2). Below this region lies a vast volume of water (from 1~2 to 4~5 km, ~deep or abyssal ocean) 3). The deep ocean is everywhere very cold T < 4oC almost everywhere below 2km T typically falls within 0-2oC at 4km In contrast to widespread area of SST of the order of 20oC
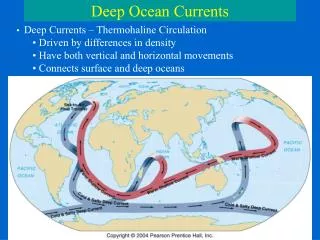
No major heat source or sink within deep ocean Waters of such low temperatures can only be formed in both polar regions (10-20 Sv each) The presence at lower latitudes of such waters implies a large-scale deep circulation, the abyssal circulation It is much easier for water to move along isopycnals than to mix vertically If vertical convection played a major role in the mixing of deep ocean waters, it would be much harder to track water masses thousands of kilometers from their origins Why is the deep ocean so cold?
One of the oldest methods of classification is the temperature-salinity diagram (or T-S diagram). In any given area, a plot of temperature versus salinity data, from near the surface to the bottom, has distinctive and reproducible characteristics (excluding the top 100m, where seasonal temperature changes dominate). All data from a given region of the ocean can be expected to fall within a certain envelope, with greater variation near surface than at depth. Inspection of the shape of the curve allows one to distinguish between water masses.
The process of deep water circulation Although the origins and characteristics of the deep water are reasonably well known, much less is known about the processes by which the water comes to fill the deep ocean. Is it by deep underwater currents such as we have in the surface ocean, or is it by some slow mixing and diffusion process in which heat and salt are being transferred by eddy diffusion with no net transfer of mass? Both processes are important, but the relative role of each has yet to be sorted out. (Knauss, p180-181) It has been suggested that most north-south advection is by the deep western boundary currents and that most east-west movement in the deep water is by turbulent diffusion. It remains to be seen whether such a hypothesis is substantiated. One problem with the development of any theory of deep circulation is that we have little direct evidence of where the water returns to the surface. The sources of deep water are few and are known. However, the water that sinks from the surface must be replaced. It is not known whether the primary mechanism of return is limited to a few locations, such as regions of upwelling, or whether most of the water returns slowly over such a wide area that it cannot be detected. (Knauss, p182-183)
Deep Water MassesWaters filled in different deep ocean basins have distinct characters
Water mass formation by deep convection Deep convection occurs in regions of weak density stratification (mostly in polar and subpolar regions). When the water in the mixed layer gets denser than the water below, it sinks to great depth, in some regions reaching to the ocean floor. The density increase can be achieved by cooling or an increase in salinity (either through evaporation or through brine concentration during freezing) or both.
Sea Ice Covers 6-8% of ocean High reflectivity (Albedo 30-40%) (A barrier to solar radiation) Always colder than underline water (heat flux from ocean to the ice)
Halocline • A layer of rapidly changing salinity at about 50-200 meters in high latitudes of ice covered regions • The cooling temperature mostly freezes fresh water into ice crystals, leaving salt trapped in brine pocket • The unfrozen water sink and mix with sea water below
Track of Antarctic Bottom Water and North Atlantic Deep Water
Near Boundery Sinking 1). Dense water forms over the continental shelf, due to surface cooling and salt rejection during ice formation. The resulting convection yields cold, salty water at the depth on the shelf 2). Horizontal density gradient parallel to the coast produces local circulations for the resevior to empty 3). Mixing with an off-shore water mass increases the density (cabbeling) 4). Dense, salty water on the shelf desends the slope under a balance of Coriolis, gravity, and frictional forces. The thermobaric effect may also contribute to the sinking
Sources of Antarctic Bottom WaterSinking around Antarctica The bottom water originates in several areas of the Antarctic continental shelf, where water is made sufficiently cold and saline that, in flowing down the continental slope and mixing with the surrounding deep water, it is dense enough to reach the floor of the ocean. In order of decreasing amount and extent of influence on the deep water property distributions—and presumably, therefore, of rate of bottom water production—these regions are the Weddell Sea, the Ross Sea, and the Adélie Coast; perhaps there is some production off Enderby Land, too.
Weddell Sea The deep water is formed at the continental shelf, which then flow into the Weddell Sea (-2oC, S=34.4~34.8, σt=27.96) The shelf water mixes rapidly into the water above to form the Weddell Sea Bottom Water (θ= –0.7o ~ –0.8oC, σt=27.9). It is estimated that the net flow out of the Weddell Sea is about 16 x 106 m3/s. The Weddell Sea Bottom Water is very cold but fresher than the overlaying water (S~34.52).
Observations made in 1968 on a station line running eastward from Antarctic Peninsula into Weddell Sea.
Observations made in 1968 on a station line running eastward from Antarctic Peninsula show a 200-m thick layer of relatively cold, fresh, low-silica bottom water on the slope, extending onto the floor of the Weddell Sea. The evidence points to a flow of shelf water down the slope, entraining and being diluted by the surrounding water on its way. (The continental shelf is unreachable throughout a year because of ice cover). Potential temperature Salinity Dissolved silica concentration Similar sections near 40oW, 29oW, 10oW-20oW show that the down slope flow gradually diminishes to the eastward.
The distribution of bottom potential temperature in the Weddell Sea demonstrates that the newly formed bottom water leaves the continental slope mainly at the northern tip of the Antarctic Peninsula, near 63o-65oS. At the edge of the continental shelf, the water has θ= –1.2 to –1.4oC the rate of sinking is 2-5x10⁶ m3/s.
Other Sources of the Bottom Water Ross Sea More saline and denser water (S>34.72, σt=28.1 ) are found near the bottom of ocean in the southwestern Pacific, north of the Ross Sea near the mid-ocean ridge (about 65oS), and close to Antarctica south of Australia. This high salinity bottom water can be traced back to the deep depressions on the shelf of Ross Sea. The cold saline shelf water has been observed to descend the western continental slope in a manner similar to that of the down slope flow in the Weddell Sea. The off shelf flux is roughly 0.6 x 10⁶ m3/s Adélie Coast Deep depressions of much smaller area on the continental shelf of the Adélie Coast of Antarctica. They are filled below their sill depths with water temperature close to the freezing point, and of salinity 34.4—34.7, probably as a result of deep convection associated with winter sea-ice formation. Such water spilling over the sills forms a layer a few tens of meters thick on the near-by continental slope, underlying the high salinity bottom water from the Ross Sea. The flow down the continental slope appears intermittent. This low-salinity bottom water mixes into the Ross Sea water rapidly enough that it has not been detected far from the continental rise near its point of origin. Enderby Land Small amount of bottom water production.
Antarctic Bottom Water • Bottom water from these several sources mixes with the warmer, more saline water above (the Antarctic Circumpolar Water) to form the “Antarctic Bottom Water” of the world ocean. Wedell and Ross Seas. (σt =27.96, T=0.3oC, S=34.7-34.8 at sub-Antarctic zone 40-50oS). • The Antarctic Bottom Water is the coldest, and the densest, deep water in the open ocean, detectable into northern latitudes by low temperatures close to the bottom. • The Antarctic Bottom Water flows into the South Atlantic and eastward through the Indian and Pacific sectors of the Southern Ocean. Below 4000m depth, all Atlantic Ocean basins are mainly occupied by the Antarctic Bottom Water.
Passages of AABW The path of Antarctic Bottom Water is strongly affected by the topography. The water mass spreads northward from both east and west of the Mid-Atlantic Ridge. On the western side, it is detectable well into the northern hemisphere past 50oN. On the eastern side, the water flows along the Walvis Ridge (20oS-30oS). Since the basin is closed in the north below the 3000m level at the Walvis Ridge, its northward progress comes to a halt there. The flow follows the depth contours in cyclonic motion, and the bottom water leaves the basin on the eastern side toward s the Indian Ocean. Antarctic Bottom Water enters the eastern basins north of the Walvis Ridge near the equator by passing the Romanche Fracture Zone. As a result, potential temperature increases slowly both northward and southward from the equator in the eastern basins.