Download
1 / 12
120 likes | 306 Views
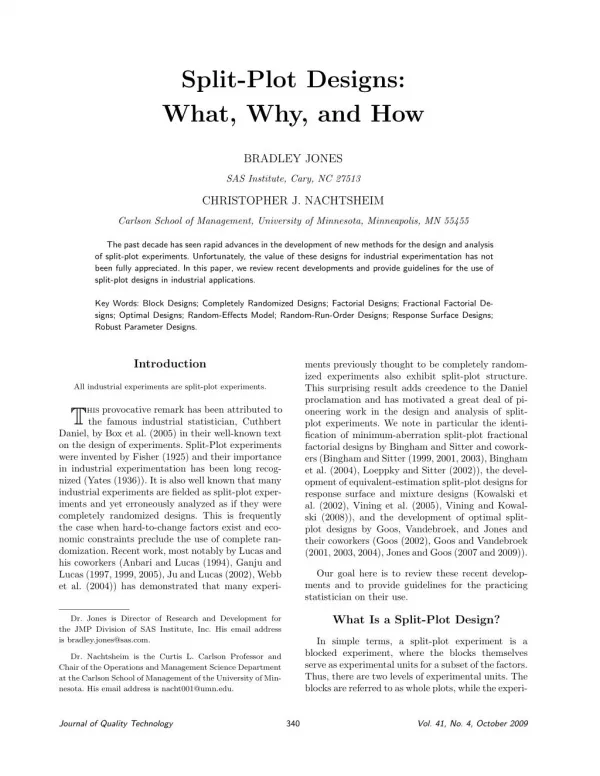
Split-Plot Experiment. Top Shrinkage by Wool Fiber Treatment and Number of Drying Revolutions J. Lindberg (1953). “Relationship Between Various Surface Properties of Wool Fibers: Part II: Frictional Properties,” Textile Research Journal , Vol. 23, pp. 225-237. Data Description.

E N D
Split-Plot Experiment Top Shrinkage by Wool Fiber Treatment and Number of Drying Revolutions J. Lindberg (1953). “Relationship Between Various Surface Properties of Wool Fibers: Part II: Frictional Properties,” Textile Research Journal, Vol. 23, pp. 225-237
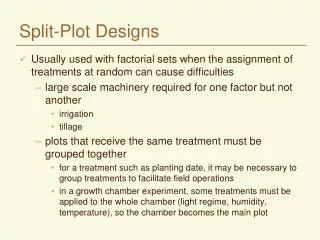
Data Description • Experiment to Compare 4 Wool Fiber Treatments at 7 Dry Cycle Lengths over 4 Experimental Runs (Blocks) • Response: Top Shrinkage of Fiber • Restriction on Randomization: Within Each block, each treatment is assigned to whole plot, then measurements made at each of 7 dry cycle times (split plots) • Whole Plot Treatments: Untreated, Alcoholic Potash (15 Sec, 4Min, 15Min) • Subplot Treatments: Dry Cycle Revolutions (200 to 1400 by 200) • Blocks: 4 Experimental Runs (possibly different days)
Block Layout Whole Plot Within each block, randomize the 4 treatments to the 4 whole plots Subplot
Marginal Means No Clear Run Effects As Alcoholic Potash increases (TRT), Shrinkage Decreases As #Revs increases, Shrinkage Increases
Analysis of Variance Note that there is a significant interaction (as well as main effects). Thus the “profile” relating shrinkage to # of revolutions differs by treatment
Decomposing the Revolution and Trt/Rev Interaction Sum of Squares into Polynomial Effects • Note that for Revolutions, we have thus far treated these as “nominal” categories, however, it is a continuous variable • We can break down its sums of squares into orthogonal polynomials representing linear, quadratic, cubic, … components (6 in all) • Graph appears to show at least linear and quadratic terms. • Similar breakdown can be done on Treatment/Revolution interaction
Partitioning of SSRevs and SSTrtxRevs The Revolution Main effect and the Treatment/Revolution Interaction is made up of significant linear and quadratic components
Procedure for Obtaining Polynomial SS 1. Obtain coefficients for orthogonal polynomials from stat design or math source
Procedure for Obtaining Polynomial SS • This process can also be extended to the TreatmentxRev interaction by: • apply it within treatments (there are only 4 samples per Trt/Rev combination) • Sum each polynomial component over treatments and subtract results from 3)
EXCEL Calculations of Polynomial SS Note the second and last rows (of the numeric values) give the polynomial sums of squares for the factors Rev, and Trt x Rev, respectively.