Download
1 / 16
160 likes | 281 Views
Antarctic Peninsula (gothic cathedral). Ocean. Island. 12 mi. http://svs.gsfc.nasa.gov/vis/a000000/a002400/a002421/index.html. 20 km. Melt ponds. Icebergs. Larsen B Ice Shelf (flying buttress). Island. January 31, 2002. 12 mi.

E N D
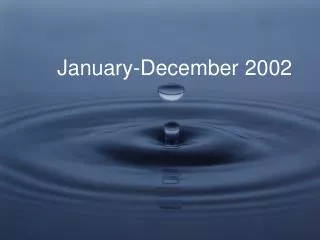
Antarctic Peninsula (gothic cathedral) Ocean Island 12 mi http://svs.gsfc.nasa.gov/vis/a000000/a002400/a002421/index.html 20 km Melt ponds Icebergs Larsen B Ice Shelf (flying buttress) Island January 31, 2002
12 mi http://svs.gsfc.nasa.gov/vis/a000000/a002400/a002421/index.html 20 km January 31, 2002
12 mi http://svs.gsfc.nasa.gov/vis/a000000/a002400/a002421/index.html 20 km March 7, 2002. 8x tributary flow-speed increase followed
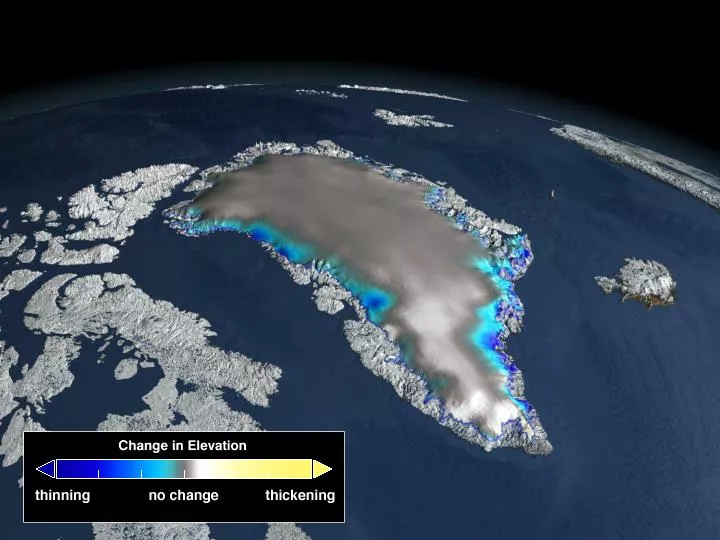
Jakobshavn Ice Stream in Greenland Discharge from many major Greenland ice streams has accelerated markedly. Source: Prof. Konrad Steffen, Univ. of Colorado
Rock 5 km Floating ice mess Berg 2004 Ice Flow 2000 2003 1992 2002 Rock Jakobshavn Isbrae, W. Greenland. Retreat with speed doubling during ice-shelf loss, which likely was caused by warming. Image courtesy Ian Joughin (Alley et al., 2005).
CO2 in atmosphere has followed IPCC-linked projections closely. Temperature rise has been a bit larger than central projections, but well within error bars. Sea-level rise has been well above central projections, and barely within error bars. Rahmstorf et al., Science, 2007
Model-based projections of global average sea level rise at the end of the 21st century (2090-2099) are shown in Table SPM-3. For each scenario, the midpoint of the range in Table SPM-3 is within 10% of the TAR model average for 2090-2099. The ranges are narrower than in the TAR mainly because of improved information about some uncertainties in the projected contributions15. {10.6} 15 TAR projections were made for 2100, whereas projections in this Report are for 2090-2099. The TAR would have had similar ranges to those in Table SPM-2 if it had treated the uncertainties in the same way. [p. 15]
Model-based projections of global average sea level rise at the end of the 21st century (2090-2099) are shown in Table SPM-3. For each scenario, the midpoint of the range in Table SPM-3 is within 10% of the TAR model average for 2090-2099. The ranges are narrower than in the TAR mainly because of improved information about some uncertainties in the projected contributions15. {10.6} 15 TAR projections were made for 2100, whereas projections in this Report are for 2090-2099. The TAR would have had similar ranges to those in Table SPM-2 if it had treated the uncertainties in the same way. [p. 15]
Merged S & W Greenland coastal temperatures infilled, Ilulissat, Nuuk and Qaqortoq. Vinther, B.M., K.K. Andersen, P.D. Jones, K.R. Briffa and J. Cappelen, Extending Greenland Temperature Records into the late 18th Century, JGR, 111, D11105. http://www.cru.uea.ac.uk/cru/data/greenland/swgreenlandave.dat) B=Box+ 2006; C=Chen+ 2006; Cz=Cazenave+ 2008; H=Hanna+ 2005; I=IPCC 2007L=Luthcke+ 2006; T=Thomas+ 2006; Z=Zwally+ 2006; R (dashed)=Rignot+Kanagaratnam 2006; R (solid)=Rignot+ 2008 S=Shepherd+ 2007; RL=Ramillien+ 2006; V=Velicogna+Wahr 2005; W=Wouters+ 2008 tan+orange=snowfall-melt-assumed discharge; green+violet primarily altimetry; red=snowfall-melt-discharge; dark blue=GRACE; light blue=assessment; updated from Alley et al., 2007
Greenland ice sheet has **grown with cooling; **shrunk with warming; **disappeared when too warm. US Govt. CCSP SAP 1.2, ch. 6; Published electronically Jan., 2009. Marine Isotope Stages shown in black, approximate ages in red. 440 ka? 130 ka 5 ka 0 ka 20 ka 140 ka?
Meltwater drains through Greenland • Accelerates flow somewhat by lubricating the bed (averaged over a year, effect of surface meltwater on basal velocity probably order of 10%, so while additional melt in future may speed mass loss, but probably not huge); • Thermal effects of surface meltwater may be more important… Zwally et al., 2002, Science
Shepherd et al., 2004, GRL 1oC warming gives 10 m/year more melt. So ice shelves expected to be very sensitive to even small climate changes.