Download
1 / 48
480 likes | 499 Views
Demand, Supply, and Market Equilibrium. Firms and Households: The Basic Decision-Making Units. A firm is an organization that transforms resources (inputs) into products (outputs). Firms are the primary producing units in a market economy.

E N D
Firms and Households:The Basic Decision-Making Units • A firm is an organization that transforms resources (inputs) into products (outputs). Firms are the primary producing units in a market economy. • An entrepreneur is a person who organizes, manages, and assumes the risks of a firm, taking a new idea or a new product and turning it into a successful business. • Households are the consuming units in an economy.
Input Markets and Output Markets:The Circular Flow • The circular flow of economic activity shows how firms and households interact in input and output markets.
Input Markets and Output Markets:The Circular Flow • Product or output markets are the markets in which goods and services are exchanged. • Input markets are the markets in which resources—labor, capital, and land—used to produce products, are exchanged.
Input Markets and Output Markets:The Circular Flow • Goods and services flow clockwise. Firms provide goods and services; households supply labor services. • Payments (usually money) flow in the opposite direction (counterclockwise) as the flow of labor services, goods, and services.
Input Markets and Output Markets:The Circular Flow • Input or factormarkets are the markets in which the resources used to produce products are exchanged. They include: • The labor market, in which households supply work for wages to firms that demand labor.
Input Markets and Output Markets:The Circular Flow • Input or factormarkets are the markets in which the resources used to produce products are exchanged. They include: • The capital market, in which households supply their savings, for interest or for claims to future profits, to firms that demand funds to buy capital goods.
Input Markets and Output Markets:The Circular Flow • Input or factormarkets are the markets in which the resources used to produce products are exchanged. They include: • The land market, in which households supply land or other real property in exchange for rent.
Input Markets and Output Markets:The Circular Flow • Inputs into the production process are also called factors of production.
Demand in Product/Output Markets • The price of the product in question. • The income available to the household. • A household’s decision about the quantity of a particular output to demand depends on:
Demand in Product/Output Markets • The household’s amount of accumulated wealth. • The prices of other products (substitutes and complements) available to the household. • A household’s decision about the quantity of a particular output to demand depends on:
Demand in Product/Output Markets • The household’s tastes and preferences. • The household’s expectations about future income, wealth, and prices. • A household’s decision about the quantity of a particular output to demand depends on:
Demand in Product/Output Markets • Quantity demanded is the amount (number of units) of a product that a household would buy in a given time period if it could buy all it wanted at the current market price.
Changes in Quantity Demanded Versus Changes in Demand • The most important relationship in individual markets is that between market price and quantity demanded.
Changes in Quantity Demanded Versus Changes in Demand • We use the ceteris paribus or “all else equal” device, to examine the relationship between the quantity demanded of a good per period of time and the price of that good, while holding income, wealth, other prices, tastes, and expectations constant.
Changes in Quantity Demanded Versus Changes in Demand • Changes in price affect the quantity demanded per period. • Changes in income, wealth, other prices, tastes, or expectations affect demand.
Price and Quantity Demanded:The Law of Demand • A demand schedule is a table showing how much of a given product a household would be willing to buy at different prices. • Demand curves are usually derived from demand schedules.
Price and Quantity Demanded:The Law of Demand • The demand curve is a graph illustrating how much of a given product a household would be willing to buy at different prices.
Price and Quantity Demanded:The Law of Demand • The law of demand states that there is a negative, or inverse, relationship between price and the quantity of a good demanded and its price. • This means that demand curves slope downward.
Other Determinantsof Household Demand • Income is the sum of all households wages, salaries, profits, interest payments, rents, and other forms of earnings in a given period of time. It is a flow measure. • Wealth, or net worth, is the total value of what a household owns minus what it owes. It is a stock measure.
Other Determinantsof Household Demand • Normal Goods are goods for which demand goes up when income is higher and for which demand goes down when income is lower. • Inferior Goods are goods for which demand falls when income rises.
Other Determinantsof Household Demand • Substitutes are goods that can serve as replacements for one another; when the price of one increases, demand for the other goes up. • Perfect substitutes are identical products.
Other Determinantsof Household Demand • Complements are goods that “go together”; a decrease in the price of one results in an increase in demand for the other, and vice versa.
Shift of Demand VersusMovement Along a Demand Curve • A change in demand is not the same as a change in quantity demanded. • A higher price causes lower quantity demanded and a move along the demand curve DA. • Changes in determinants of demand, other than price, cause a change in demand, or a shift of the entire demand curve, from DA to DB.
Change in price of a good or service leads to Change in quantity demanded(Movement along the curve). Change in income, preferences, orprices of other goods or services leads to Change in demand (Shift of curve). A Change in Demand Versusa Change in Quantity Demanded To summarize:
The Impact of a Change in Income • Higher income decreases the demand for an inferior good • Higher income increases the demand for a normal good
The Impact of a Changein the Price of Related Goods • Demand for complement good (ketchup) shifts left • Demand for substitute good (chicken) shifts right • Price of hamburger rises • Quantity of hamburger demanded per month falls
From HouseholdDemand to Market Demand • Demand for a good or service can be defined for an individual household, or for a group of households that make up a market. • Market demand is the sum of all the quantities of a good or service demanded per period by all the households buying in the market for that good or service.
From HouseholdDemand to Market Demand • Assuming there are only two households in the market, market demand is derived as follows:
Supply in Product/Output Markets • Supply decisions depend on profit potential. • Profit is the difference between revenues and costs.
Supply in Product/Output Markets • Quantity supplied represents the number of units of a product that a firm would be willing and able to offer for sale at a particular price during a given time period. • A supply schedule is a table showing how much of a product firms will supply at different prices.
Price and Quantity Supplied:The Law of Supply • A supply curve is a graph illustrating how much of a product a firm will supply per period of time at different prices.
Price and Quantity Supplied:The Law of Supply • The law of supply states that there is a positive relationship between price and quantity of a good supplied. • This means that supply curves typically have a positive slope.
Other Determinants of Supply • The price of the good or service. • The cost of producing the good, which in turn depends on: • The price of required inputs (labor, capital, and land), • The technologies that can be used to produce the product, • The prices of related products.
Shift of Supply VersusMovement Along a Supply Curve • A higher price causes higher quantity supplied, and a move along the demand curve. • A change in determinants of supply other than price causes an increase in supply, or a shift of the entire supply curve, from SA to SB.
Shift of Supply Curve for SoybeansFollowing Development of a New Seed Strain • In this example, since the factor affecting supply is not the price of soybeans but a technological change in soybean production, there is a shift of the supply curve rather than a movement along the supply curve. • The technological advance means that more output can be supplied for at any given price level.
Shift of Supply VersusMovement Along a Supply Curve Change in price of a good or service leads to Change in quantity supplied(Movement along the curve). Change in costs, input prices, technology, or prices of related goods and services leads to Change in supply (Shift of curve). To summarize:
From IndividualSupply to Market Supply • The supply of a good or service can be defined for an individual firm, or for a group of firms that make up a market or an industry. • Market supply is the sum of all the quantities of a good or service supplied per period by all the firms selling in the market for that good or service.
From IndividualSupply to Market Supply • As with market demand, market supply is the horizontal summation of individual firms’ supply curves.
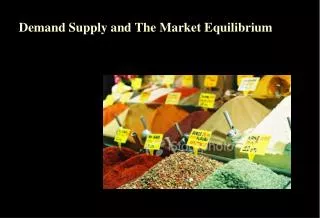
Market Equilibrium • Marketequilibrium is the condition that exists when quantity supplied and quantity demanded are equal. • At equilibrium, there is no tendency for the market price to change.
Market Equilibrium • Only in equilibrium is quantity supplied equal to quantity demanded. • At any price level other than P0, such as P1, quantity supplied does not equal quantity demanded.
Excess Demand • Excess demand, or shortage, is the condition that exists when quantity demanded exceeds quantity supplied at the current price. • When quantity demanded exceeds quantity supplied, price tends to rise until equilibrium is restored.
Excess Supply • Excess supply, or surplus, is the condition that exists when quantity supplied exceeds quantity demanded at the current price. • When quantity supplied exceeds quantity demanded, price tends to fall until equilibrium is restored.
Higher demand leads to higher equilibrium price and higher equilibrium quantity. Higher supply leads to lower equilibrium price and higher equilibrium quantity. Changes in Equilibrium
Lower demand leads to lower price and lower quantity exchanged. Lower supply leads to higher price and lower quantity exchanged. Changes in Equilibrium
Relative Magnitudes of Change • The relative magnitudes of change in supply and demand determine the outcome of market equilibrium.
Relative Magnitudes of Change • When supply and demand both increase, quantity will increase, but price may go up or down.
Review Terms and Concepts capital market complements, complementary goods demand curve demand schedule entrepreneur equilibrium excess demand or shortage excess supply or surplus factors of production firm households income inferior goods input or factor markets labor market land market law of demand law of supply market demand market supply movement along a demand curve normal goods perfect substitutes product or output markets profit quantity demanded quantity supplied shift of a demand curve substitutes supply curve supply schedule wealth or net worth