Download
1 / 20
200 likes | 213 Views
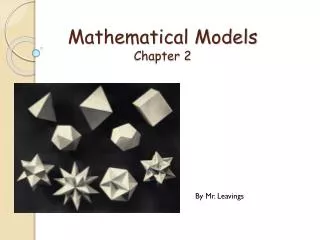
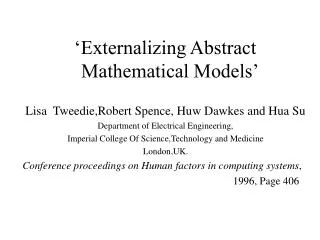
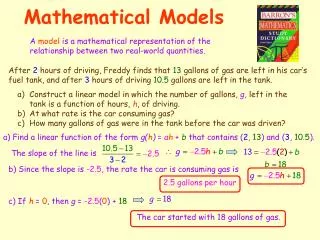
Mathematical Models 1.1a. Includes…geometric formulas, regression analysis, solving equations in 1 variable. Definitions. A mathematical model is a mathematical structure that approximates phenomena for the purpose of studying or predicting their behavior.

E N D
Mathematical Models 1.1a Includes…geometric formulas, regression analysis, solving equations in 1 variable
Definitions A mathematical model is a mathematical structure that approximates phenomena for the purpose of studying or predicting their behavior One type of mathematical model: numerical model, where numbers (or data) are analyzed to gain insights into phenomena
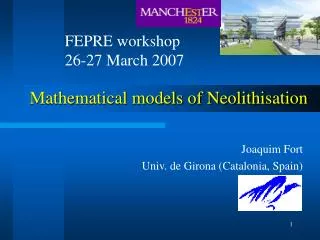
Table 1.1 The Minimum Hourly Wage Year Min. Hourly Purchasing Power Wage in 2001 Dollars 1940 0.30 3.68 1945 0.30 2.88 1950 0.75 5.43 1955 0.75 4.79 1960 1.00 5.82 1965 1.25 6.84 1970 1.60 7.23 1975 2.10 6.88 1980 3.10 6.80 1985 3.35 5.48 1990 3.35 4.57 1995 4.25 4.94 2000 5.15 5.34 • How much did • Proctor get paid at • his first job? 2. What is the national minimum wage (as of summer 2009)? $7.25
Table 1.1 The Minimum Hourly Wage Year Min. Hourly Purchasing Power Wage in 2001 Dollars 1940 0.30 3.68 1945 0.30 2.88 1950 0.75 5.43 1955 0.75 4.79 1960 1.00 5.82 1965 1.25 6.84 1970 1.60 7.23 1975 2.10 6.88 1980 3.10 6.80 1985 3.35 5.48 1990 3.35 4.57 1995 4.25 4.94 2000 5.15 5.34 3. In what five-year period did the actual minimum wage increase the most? Between 1975 and 1980, it increased by $1.00
Table 1.1 The Minimum Hourly Wage Year Min. Hourly Purchasing Power Wage in 2001 Dollars 1940 0.30 3.68 1945 0.30 2.88 1950 0.75 5.43 1955 0.75 4.79 1960 1.00 5.82 1965 1.25 6.84 1970 1.60 7.23 1975 2.10 6.88 1980 3.10 6.80 1985 3.35 5.48 1990 3.35 4.57 1995 4.25 4.94 2000 5.15 5.34 4. In what year did a minimum-wage worker have the greatest purchasing power? In 1970 5. What was the longest period during which the minimum wage did not increase? From 1940-1945, 1950-1955, and 1985-1990
Table 1.1 The Minimum Hourly Wage Year Min. Hourly Purchasing Power Wage in 2001 Dollars 1940 0.30 3.68 1945 0.30 2.88 1950 0.75 5.43 1955 0.75 4.79 1960 1.00 5.82 1965 1.25 6.84 1970 1.60 7.23 1975 2.10 6.88 1980 3.10 6.80 1985 3.35 5.48 1990 3.35 4.57 1995 4.25 4.94 2000 5.15 5.34 6. A worker making min. wage in 1980 was earning nearly twice as much as a worker making min. wage in 1970 so why was there pressure to once again raise the min. wage? Purchasing power actually dropped by $0.43 during that period (inflation)
Table 1.1 The Minimum Hourly Wage Year Min. Hourly Purchasing Power Wage in 2001 Dollars 1940 0.30 3.68 1945 0.30 2.88 1950 0.75 5.43 1955 0.75 4.79 1960 1.00 5.82 1965 1.25 6.84 1970 1.60 7.23 1975 2.10 6.88 1980 3.10 6.80 1985 3.35 5.48 1990 3.35 4.57 1995 4.25 4.94 2000 5.15 5.34 7. How many of you earn the minimum hourly wage? do you think that it is set at a fair level?
Definitions Another type of mathematical model: Algebraic Model– uses formulas to relate variable quantities associated with the phenomena being studied (Benefit: can generate numerical values of unknown quantities using known quantities)
Guided Practice: A restaurant sells a rectangular 18” by 24” pizza for the same price as its large round pizza (24” diameter). If both pizzas are of the same thickness, which option gives the most pizza for the money? Calculate Areas: Rectangular pizza = Circular pizza = The round pizza is larger, and is therefore the better deal
Guided Practice At Dominos, a small (10” diameter) cheese pizza costs $4.00, while a large (14” diameter) cheese pizza costs $8.99. Assuming that both pizzas are the same thickness, which is the better value? Calculate areas per dollar cost: Small Pizza Large Pizza 2 2 Small: 19.635 in /$, Large: 17.123 in /$ The small pizza is the better value!!!
Definition: Another type of mathematical model: Graphical Model– visual representation of a numerical or algebraic model that gives insight into the relationships between variable quantities Regression Analysis: The process of analyzing data by creating a scatter plot, critiquing the data’s appearance (linear, parabolic, cubic, etc.), choosing the appropriate model, finding the line of best fit, making predictions about the data….Handout!
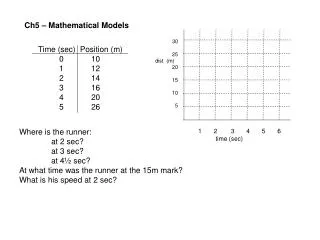
A Good Example: Galileo gathered data on a ball rolling down an inclined plane: 1. Create a scatter plot of these data 2. Derive an algebraic model to fit these data 2 d = 0.75t 3. Graph this function on top of your scatter plot
A Good Example: Galileo gathered data on a ball rolling down an inclined plane: 4. How far will the ball have traveled after 15 seconds? d = 168.75 in 5. How long will it take the ball to travel 62 inches? t = 9.092 sec
More Practice Problems… 3 2 Find all real numbers x for which 6x = 11x + 10x 5 2 x = 0 or x = or x = – 2 3 We just used the Zero Factor Property: A product of real numbers is zero if and only if at least one of the factors in the product is zero.
Terminology: If a is a real number that solves the equation f(x) = 0, then these three statements are equivalent: 1. The number a is a root (or solution) of the equation f(x) = 0. 2. The number a is a zero of y = f(x). 3. The number a is an x-intercept of the graph of y = f(x). (sometimes the point (a, 0) is referred to as an x-intercept)
Guided Practice Solve the equation algebraically and graphically.
Guided Practice Solve the equation algebraically and graphically.
Guided Practice.. Solve the equation algebraically and graphically.
Guided Practice Solve the equation algebraically and graphically. Use the quadratic formula: Check for extraneous solutions!!!
Whiteboard if time… #24 on p.77-78 (a) Scatterplot window: (b) Graph in same window: (c) Solve: In 2005 (d) No, the algebraic model will probably not be valid in future years…why not? Homework: p. 76-78 1-17 all, 29-37 odd