Download
1 / 8
120 likes | 362 Views
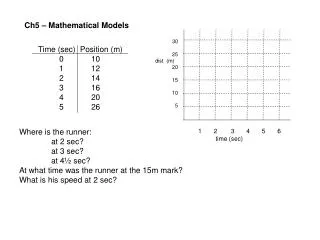
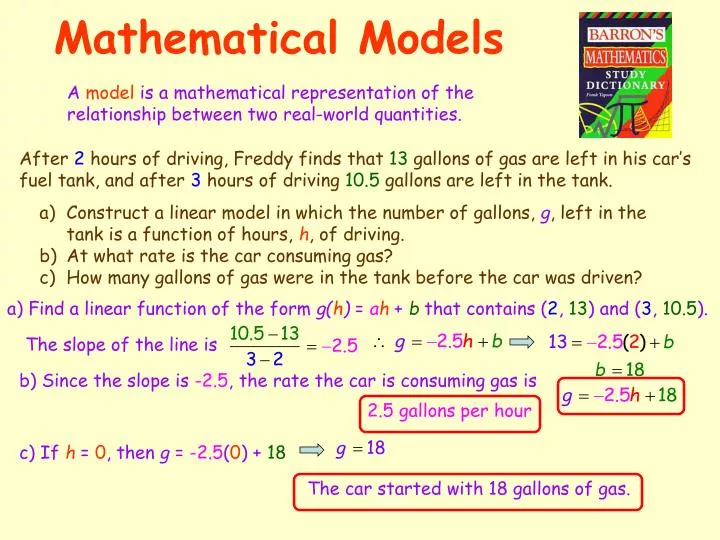
Mathematical Models. A model is a mathematical representation of the relationship between two real-world quantities. After 2 hours of driving, Freddy finds that 13 gallons of gas are left in his car’s fuel tank, and after 3 hours of driving 10.5 gallons are left in the tank.

E N D
Mathematical Models A model is a mathematical representation of the relationship between two real-world quantities. After 2 hours of driving, Freddy finds that 13 gallons of gas are left in his car’s fuel tank, and after 3 hours of driving 10.5 gallons are left in the tank. • Construct a linear model in which the number of gallons, g, left in the tank is a function of hours, h, of driving. • At what rate is the car consuming gas? • How many gallons of gas were in the tank before the car was driven? a) Find a linear function of the form g(h) = ah + b that contains (2, 13) and (3, 10.5). The slope of the line is b) Since the slope is -2.5, the rate the car is consuming gas is 2.5 gallons per hour c) If h = 0, then g = -2.5(0) + 18 The car started with 18 gallons of gas.
Scatterplots The accompanying table shows the number of applications for admissions that a college received for certain years. Create a scatterplot that models this data. Let x = 1 represent 1991, x = 3 represent 1993 and so on so that x = 10 represents 2000. Store the data Press STAT ENTER Enter x values in L1 and corresponding y values in L2. Set up the Scatterplot Press 2nd STAT PLOT ENTER ENTER Display the Scatterplot Or press GRAPH Press ZOOM 9 That was easy
Calculating a Regression Line A Regression Line is a linear model that best approximates a set of data points. The Regression Line is also called a Line of Best Fit. Let’s use the data from the previous table to calculate the line of regression. Press STAT > (CALC) 4 (LinReg(ax+b)) It’s helpful to store the equation as Y1 > VARS (Y-VARS) 1 (Function) 1 (Y1) ENTER The r-value is the Correlation Coefficient. This value will be between -1 and +1. The closer the absolute value is to 1, the more closely the regression line fits the data. The equation of the regression line is
Comparing Correlation Coefficients As x increases, y increases. The closer r is to 1, the better a line fits the data and the stronger the linear relationship is. As x increases, y decreases. The closer r is to -1, the better a line fits the data and the stronger the linear relationship is. There is no significant linear relationship between x and y. The closer r is to 0, the weaker the linear relationship is.
Those are some pretty funny-looking words. I wonder what they mean. Making Predictions Interpolation: Estimating within the range of observed data. Extrapolation: Estimating outside the range of observed data. Let’s use the data from the previous table to do some interpolating and some extrapolating. Interpolation: Estimate the number of applicants the school had in 1997. Plug the x-value into the equation. 7 The school had about 518 applicants in 1997. Extrapolation: Estimate the number of applicants the school will have in 2009. Plug the x-value into the equation. 19 The school will have about 1,012 applicants in 2009.
Calculating Exponential Regression AUG06 31 DefCon 3 ExpReg y = abx a = 379.92 b = 1.04 r2 = 1.00 r = 1.00 This is Sam Ting as linear regression, only you push different buttons. Asi De Facil
Calculating Power Regression JAN07 30 DefCon 3 PwrReg y = axb a = 451.431 b = -.243 r2 = .956 r = .978 This is Sam Ting as linear regression and exponential regression, only you push different buttons. Asi De Facil
Multiple Choice Questions Which scatter diagram shows the strongest positive correlation? Which graph represents data used in a linear regression that produces a correlation coefficient closest to -1? That was easy