Download
1 / 49
500 likes | 645 Views
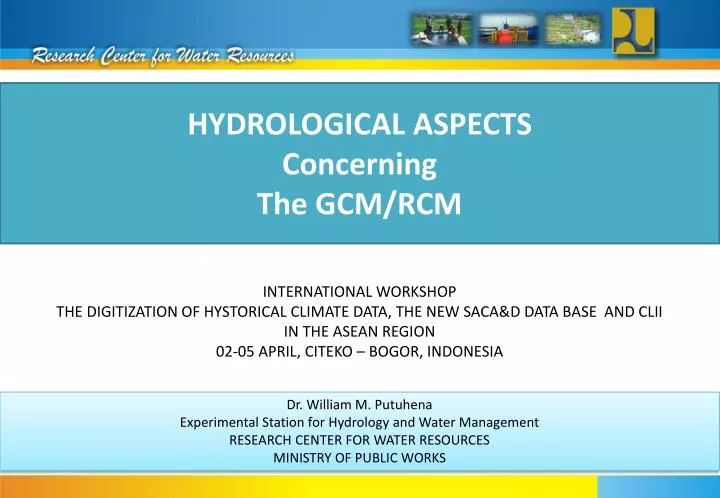
Hydrological Aspects Concerning The GCM/RCM. INTERNATIONAL WORKSHOP THE DIGITIZATION OF HYSTORICAL CLIMATE DATA, THE NEW SACA&D DATA BASE AND CLII IN THE ASEAN REGION 02-05 APRIL, CITEKO – BOGOR, INDONESIA. Dr. William M. Putuhena Experimental Station for Hydrology and Water Management

E N D
Hydrological Aspects ConcerningThe GCM/RCM INTERNATIONAL WORKSHOP THE DIGITIZATION OF HYSTORICAL CLIMATE DATA, THE NEW SACA&D DATA BASE AND CLII IN THE ASEAN REGION 02-05 APRIL, CITEKO – BOGOR, INDONESIA Dr. William M. Putuhena Experimental Station for Hydrology and Water Management RESEARCH CENTER FOR WATER RESOURCES MINISTRY OF PUBLIC WORKS
Mechanism of global warming and climate change Large volumes of greenhouse gas emissions cause CO2 concentration in the air, increase heat absorption, and result in temperature rise, i.e. global warmings. Melting of glaciers, ice caps and ice sheets Thermal expansion of sea water Change in evapotranspiration Change in snow accumulation condition Sea level rise Increase of precipitation More intense typhoons More frequent heavy rains and droughts Earlier snow melt and reduction of discharge Change in water use pattern Increase of river flow rate More frequent storm surges and coastal erosions More frequent floods Higher risk of drought More serious sediment disasters Source: Okada, 2008
Two Modeling Systems1. Climate Model (GCM/RCM)2. Hydrological Model To provide a comprehensive understanding of the climate change impact on water resources
Hydrological Models Target Event to Continuous Model Lumped to Distributed Model Conceptual to Physical Model B Model
D O W N S C A L I N G
Design Rainfall Design Hydrograph Current Design Rainfall Future Design Rainfall under Climate Change 1 Discharge (m^3/s) Climate Change Hydrological Model Current Climate T
Temporal Scales Mismatch Temporal Scales Seasonal Annual Monthly Daily Hourly Minute Hydrological Model GCMs Hydrological Importance Increases GCMs Ability Declines
Data Feed Satellite Radar Telemetry NWP Flood Lead Time River discharge accuration decreases Time Present condition Flood forecasting Detections Run-off analysis Warning Response
Vertical Scales Mismatch GCMs Tools for Atmosphere/ Ocean Modeling Hydrological Model Tools for Surface Earth Modeling GCMs accuracy decreases from free tropospheric variables to surface variables, while the variables at the ground surface have direct use in water balance computations.
Working Variables Mismatch GCMs accuracy decreases from climate related variables, i.e. wind , temperature, humidity and air pressure to precipitation evapotranspiration , runoff and soil moisture, while the later variables are of key importance in hydrologic regimes.
Declining return period by increasing rainfall Impact of climate change Return period of flood is declining by increasing rainfall in the future.As a result,future flood safety level is estimated to decrease. 【Image of declining return period at a certain area】 Maximum daily rainfall × 1.2 Return period (year) future current 100 current data projected data 50 Rainfall probability sheets Rainfall amount r Source: Okada, 2008
Changing river discharge Impact of climate change Decreasing run-offs during the peak demand season Deviation from traditional water use patterns will be required State of river run-offs after global warming (estimated) Earlier spring flooding Decreasing river run-offs River run-off Future Present Even if the rice paddy preparation season is advanced, available river run-offs in the demand season are insufficient. Wasteful discharges Jan Apr July Oct Rice paddy preparation Water in storage Full Empty dams Present Unable to store Future Source: Okada, 2008
Impact of climate change on water quality Impact of climate change Source: Okada, 2008
Rainfall Data Yearly Seasonal Monsoon Storm DRY WET DAILY MAX DJF MAM JJA SON TEST FOR THE TREND 1916-1980 1981-2000 TEST FOR THE TREND TEST FOR THE CHANGES OF THE DISTRIBUTION 1916-1940 1941-1970 1971-2000 MAP (result of the test) Identification of the Climate Change in Java Island Source: RCWR-MPW
TREND OF MAXIMUM DAILY RAINFALL IN JAVA ISLAND Catatan: • Data :Seri data hujan harian maksimum tahunan dari 1600 buah pos hujan (1916 2004) yang sudah lolos uji • Metode :Non Parametrik Tau Kendall dengan tingkat kepercayaan 95 %
Analysis of Future Precipitation affected by Climate Change on Citarum River Basin, Indonesia ADB Intern Yutaka Araki
Analysis on Citarum, Indonesia ・Most strategic river basin ・Climate Change could lead to more severe and frequent flooding, and raise sea level in the river mouth -12,000km^2 basin area -3 hydroelectric dams -1400MW -400,000ha Irrigation -80% of Jakarta’s water
Analysis on Citarum, Indonesia Target period ・50 & 80 years later (2046-2065, 2081-2100 (+1981-2000)) ・based on 2 CO2-emission-scenario - SRES A1B & B1 Tools ・17(/25 )GCMsin CMIP3
SRES(Special Report on Emissions Scenarios) Globalization A1「High economic growth」 A1FI:enphasis on fossil fuel A1B: Balanced energy use A1T: Non fossil fuel.(Technical innovation in Energy) A2「Differentiated world」 slower technological change, less emphasis on economic, social, and cultural interactions between regions, Economic growth is uneven B1「Sustainable development」 pay increased attention to the environmental, Technological change plays an important role B2「Local self-reliance and stronger communities」 shift toward local and regional decision-making structures and institutions, A1 B1 Environment-oriented Economy-oriented A2 B2 Regionalization
PCM (USA) Target Area ←Citarum River Basin 1 2 5 3 4 CCSM3.0 (USA)
Analysis items • Rainfall days over 50,10 mm/day • No rainfall days / consecutive no rainfall days • Annual rainfall • Seasonal rainfall (dry and rainy) • Probable daily rainfall (5,10,100 years return) • Flood/City drainage • Irrigation/Drought management • Water Management
No rainfall days 12%UP
Incremental Ratio of Daily Probable Rainfall (10year), A1B,50years later, from 17 models Average=1.2 (from 17 models)
Flood Simulation ・Area Citarum Upper Basin ・Return period 10 years ・Climate Current and 50 years later(A1B) Nanjung Nanjung DayeuhKolot DayeuhKolot Majalaya Majalaya
Design Rainfall Design Hydrograph Current Design Rainfall Future Design Rainfall under Climate Change 1 1.2 Discharge (m^3/s) Climate Change Hydrological Model Current Climate T
Citarum Upper Basin Increase!
Orange – Current Design Flood Purple – Future Design Flood Flood Simulation
Delft Hydraulics Upper Citarum Basin Flood Management Project UCBFM Flood Management Strategy ‘No regret’ – urgent program February 25, 2011 JanJaap Brinkman, Deltares Institutional Strengthening For Integrated Water Resources Management in the 6 CIS River Basin Territory (Package C)
Understanding the basics Is there any change? Land-use change? Yes, urbanization Climate change increasing floods? No, not yet Topography change? Yes, subsidence River change? Yes, maintenance and ‘controlled’ river normalization Flood management change? Yes, urgently required – ‘space for water management’
Climate Change -Trend analysis of daily point and basin rainfall extremes
Climate Change - Trend analysis annual rainfall in Bandung basin, Period 1879-2007
Climate Change - Seasonal rainfall in Citarum u/s Nanjung, Period 1879-2010
Rainfall characteristics Lessons learnt from the 2009-2010 flood season.
Bandung basin – hydrology • Historic floods not related to basin wide rainfall • Floods relate to local rainfall
SUMMARY Advanced GCM, RCM, and the hydrological model and also methodologies for comprehensive modeling have been developed. The two modeling systems have recently been used for quantification of the hydrological impacts of future climate change. However, the research on hydrological change is still in its infancy both with respect to model accuracy and uncertainty. Traditionally, based on the output of global or regional climate models, hydrological models have been run as stand alone models. This means that the feedbacks to the atmosphere are neglected which has an unknown impact on the predictions of the climate change, particularly at the local scale. New model should be developed by combining the regional climate model and the hydrological model. As part of the integrated model a statistical downscaling and bias-correction method should be developed for conversion of data from large climate grids to small hydrological grids. New methodologies and tools should be developed to enable easier and more accurate use of regional scale climate and hydrological models to address local scale water resources problems.
Thank you for your kind attention ! KARIKATUR: KOMPAS/ Sabtu 10 Februari 2007