Download
1 / 17
170 likes | 174 Views
Unit 2 Marketing Math. Unit 2 Vocabulary. Bar Graph Circle Graph Decimal Number Denominator Digits Fractions. Line Graph Mixed Number Numerator Percent Pie Chart. Unit 2 Essential Question.

E N D
Unit 2Vocabulary • Bar Graph • Circle Graph • Decimal Number • Denominator • Digits • Fractions • Line Graph • Mixed Number • Numerator • Percent • Pie Chart
Unit 2 Essential Question • How do you perform basic mathematical computations using fractions, percents, and decimals and display the data in a usable visual format?
Essential Question 1Marketing Math • How do you convert decimals to fractions and percent, fractions to decimals and percent, and percent to decimals and fractions?
Fractions, Decimals, Percent • Digit: The ten basic symbols of our numbering system: 0,1,2,3,4,5,6,7,8,9. • Decimal Number:A base-ten numeral that uses a decimal point and place value. • Percent: A part of a whole. A ratio that compares a number to 100. • Fraction: The division of two numbers written in the form . • Numerator:The top number in a fraction; represents the number of parts being considered. • Denominator: The bottom number in a fraction; represents the number of parts in a whole – cannot be equal to zero. • Mixed Number: A whole number and fraction together.
Fractions, Decimals, Percent • Renaming decimals as fractions. • Rename 0.85 as a fraction • Write the decimal in the numerator • Write in the denominator, the same number of zeros as digits in the numerator • Reduce the fraction • Examples: 0.6 = 8.42 = 0.034 =
Fractions, Decimals, Percent 0.9 90 • Renaming decimals as percents. • Rename 0.9 as a percent • Multiply by 100 by moving the decimal point 2 places to the right • Write in additional zeros if necessary • Write the percent sign • Examples: 0.89 = 0 . % 0.034 = 8.4 =
Fractions, Decimals, Percent 1/5 0.2 • Renaming fractions as decimals then percents. • Rename 1/5 as a percent • Write the fraction as a decimal by dividing the numerator by the denominator • Write the decimal as a percent • Examples: 3/4 = = 15 = 0.2 0 . = 20% 2 1/5 = 2/3 =
Fractions, Decimals, Percent 3% 0.03 • Renaming percents as decimals. • Rename 3% as a decimal • Divide by 100 by moving the decimal point 2 places to the left • Write in additional zeros if necessary • Remove the percent sign • Examples: 43% = . 0 % 5.7% = 287% =
Fractions, Decimals, Percent • Renaming percents as fractions. • Rename percent as a decimal • Rename the decimal as a fraction
Fractions, Decimals, Percent • Sentence problems. • What is 40% of 19. • Write the problem as an What is 40% of 19 equation. ↓ ↓ ↓ x = 40% x 19 • Rename the percent as a decimal. x =0.4 x 19 • Solve. x = 7.6
Fractions, Decimals, Percent • Sentence problems. • Examples: • Find 25% of 80. • 13 is what percent of 26? • 45 is 10% of what number?
Essential Question 2Marketing Math • How are bar graphs, line graphs, and circle graphs constructed and read?
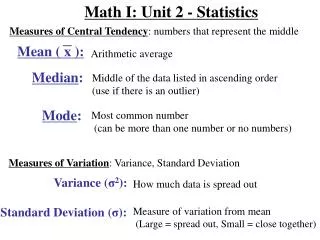
Bar, Circle, and Line Graphs • Bar Graph: A drawing made up of parallel bars whose length are proportional to the qualities being measured. • Circle Graph: A geometric representation of the relative sizes of the parts of the whole. Also known as a pie chart. • Line Graph: Graph that uses a line to join parts representing changes in a variable quantity over a specific period of time.
80 70 60 50 40 30 20 10 0 A B C D Bar Graphs • Best used to show the relationship between two variables. • Example: • Construct a bar graph to represent the data collected from a survey. SelectionNo. Responding A 23 B 72 C 45 D 60
Circle Graphs • Best used to show the relationship of a single variable; usually in terms of a percentage. • Must convert data to degrees of arc. There are 360° of arc in a circle. • Example: • Construct a circle graph to represent the types of computers sold in one year. Computer Sales Educational $ 2,000,000 Personal $ 5,200,000 Business $10,400,000 Scientific $ 2,400,000
$6.0 $5.0 $4.0 $3.0 $2.0 $1.0 $0.0 2000 2001 2002 2003 2004 Line Graphs • Best used to show the relationship of a single variable and a constant. • Example: • Construct a graph which best represents the provided data. (5 pts) YearTotal Revenue 2000 $ 3.3 million 2001 $ 4.1 million 2002 $ 3.9 million 2003 $ 4.5 million 2004 $ 4.9 million