Download
1 / 13
130 likes | 133 Views
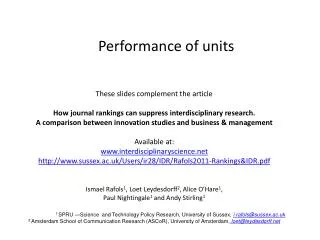
Expected performance of PoGO for the revised design (217 units) by Geant4 Simulator. PoGo Collaboration meeting at SLAC, February 7, 2004 Tsunefumi Mizuno mizuno@SLAC.Stanford.EDU History of changes: January 28, 2004 first written by T. Mizuno February 6, 2004 updated by T. Mizuno

E N D
Expected performance of PoGO for the revised design (217 units) by Geant4 Simulator PoGo Collaboration meeting at SLAC, February 7, 2004 Tsunefumi Mizuno mizuno@SLAC.Stanford.EDU History of changes: January 28, 2004 first written by T. Mizuno February 6, 2004 updated by T. Mizuno April 7, 2004 updated by T. Mizuno April 21, 2004 Fig. in page 9 were corrected by T. Mizuno PoGO_G4_2004-04-21.ppt
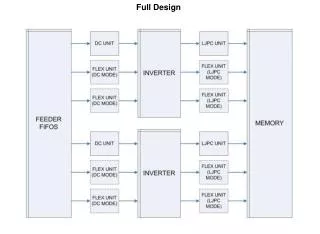
Simulated Geometry • Thickness of fast scint. = 2.63cm • (D = 2.23cm) • W (thickness of slow scint.) = 0.2cm • L1 (slow scint. length) = 60cm • L2 (fast scint. length) = 20cm • Thickness of W collimator = 0.0025cm • Thickness of btm BGO = 2.68cm • Length of btm BGO = 3cm • (not tapered in simulator for simplicity) • Gap between BGOs = 0.5cm • (including BaSo4 eflector) • Thickness of side Anti BGO = 3cm • Length of side Anti BGO = 60cm • # of units = 397 (geometrical area of fast scint. not covered by slow scint. = 1709 cm2) or 217 (934.4 cm2) PoGO_G4_2004-04-21.ppt
Simulation Condition • The same Crab spectrum as that used in Hiro’s EGS4 simulation was simulated here. That is, • E-2.1 spectrum with 100mCrab intensity, 20-200keV (300.8 c/s/m2) • 100% polarized, 6h exposure • Attenuation by air of 4g/cm2 (atmospheric depth in zenith direction is ~3g/cm2 and that in line-of-sight direction is 4g/cm2) • Atmospheric downward/upward gamma spectra for GLAST BFEM simulation were used as background. • Use Geant4 ver5.1. Possible minor bug of polarization vector after Compton scattering was fixed by user (found by Y. Fukazawa @ Hiroshima Univ.). PoGO_G4_2004-04-21.ppt
Detector Resopnses • The same detector responses as those used in Hiro’s EGS4 simulation • If there is a hit in slow/anti/btm scintillators, event is rejected. (Threshold is 3 keV). Energy smearing and poisson fluctuation are not taken into account yet for veto scintillators. • Assumed detector resposes: • 0.5 photo-electron/keV • fluctuated by poisson distribution • smeared by gaussian of sigma=0.5 keV (PMT energy resolution) • minimum hit threshold after three steps above is 3 keV PoGO_G4_2004-04-21.ppt
Event Analysis • The same as those of Hiro’s EGS4 Simulation • Use events in which two or three fast scintillators detected a hit. • The largest energy deposit is considered to be photo absorption • The second largest energy deposit is considered to be Compton scattering. • Smallest energy deposit (in case of three scintillators with hit) is ignored. • Smear azimuth angle distribution with Hiro’s resolution function. • No event selection on compton kinematics PoGO_G4_2004-04-21.ppt
Incident energy distribution of atmospheric gammas Revised Design (217 units) atmospheric downward gamma atmospheric upward gamma gammas that hit 2 or 3 fast scintillators Counts/bin gammas that pass the event selection (They are recognized as event) gamma energy (keV) Downward atmospheric gammas below a few MeV and upward ones between a few hundred keV to a few MeV contribute to background. PoGO_G4_2004-04-21.ppt
Collimator thickness dependence of the background(1) atmospheric downward gamma 217 units 397 units 100mCrab (incident) 100mCrab (detected) Flux(c/s/cm2/keV) Background due to atmospheric gamma 10um thickness, 25um thickness, 50um thickness gamma energy (keV) • # of units does not affect S/N ratio very much • Collimator (W) of 25um could be optimum (see the next slide). • Signal>background below 100 MeV. PoGO_G4_2004-04-21.ppt
Collimator thickness dependence of the background(2) atmospheric upward gamma 217 units 397 units 100mCrab (incident) 100mCrab (detected) Flux(c/s/cm2/keV) Background due to atmospheric gamma 10um thickness, 25um thickness, 50um thickness gamma energy (keV) • # of units does not affect the S/N ratio very much • Collimator (W) of 25um could be optimum (see the previous slide). • Signal>background below 100 MeV. PoGO_G4_2004-04-21.ppt
Slow scint. energy threshold dependence of the background Reduced Design (217 units) atmospheric downward gamma atmospheric upward gamma 100mCrab (incident) 100mCrab (detected) Background due to atmospheric gamma Eth=10keV, 30keV, 100keV,300keV and 1MeV Below 100 keV, veto threshold of slow scintillator does not affect the background very much. PoGO_G4_2004-04-21.ppt
Predicted Effective Area • The same energy response and event selection criteria as those of p11 are assumed. 217 units 397 units effective area (cm2) gamma energy (keV) Effective area scales as the number of units. It will be maximum at 40-50 keV and is 230cm2 and 460cm2 for 217 units and 397 units, respectively PoGO_G4_2004-04-21.ppt
Predicted Azimuth Angle Distribution • 100m Crab spectrum (E-2.1 in 20-200keV), 6 hour exposure, 100% polarized • Fit the azimuth angle distribution with p0(1+p1*cos(2*phi+pi)) • Assumed detector response and event selection criteria are given in pages 4-5 • Measured energy is 20-100 keV 217 units 397 units MF=24.4% Sensitivity; 24.4/0.83=29sigma MF=25.2% Sensitivity; 25.2/0.58=43sigma azimuth angle (radian) The sensitivity scales as the square root of the number of units (geometrical area) PoGO_G4_2004-04-21.ppt
Expected Crab observation polar cap caustic ouer gap Crab Pulsar Polarization:P1 phase=0.342+-0.045 (polar cap model) phase=1.54+-0.10 (caustic model) Phase=-0.22+-0.10 (outer cap model) polarization profiles of three models MF=3.10+-0.65% We can distinguish pulsar models in a single 6 hour observation with 217 units PoGO. Definitions of P1/P2/IP PoGO_G4_2004-04-21.ppt
Conclusions • We compared the performance of PoGO of original design (397units) and revised one (217 units) using Geant4 toolkits. • The effective area scales as the # of units. • The sensitivity scales as the square of the # of units. • Atmospheric gammas below a few MeV (downward gamma) and between a few hundred keV to a few MeV (upward gamma) contribute the background. S/N ratio does not depend on the # of unit very much. • We can distinguish Crab pulsar models in a single 6-hour observation with 217 units. • In view of the performance, we can go to the revised design (217 units). PoGO_G4_2004-04-21.ppt