Download
1 / 60
600 likes | 698 Views
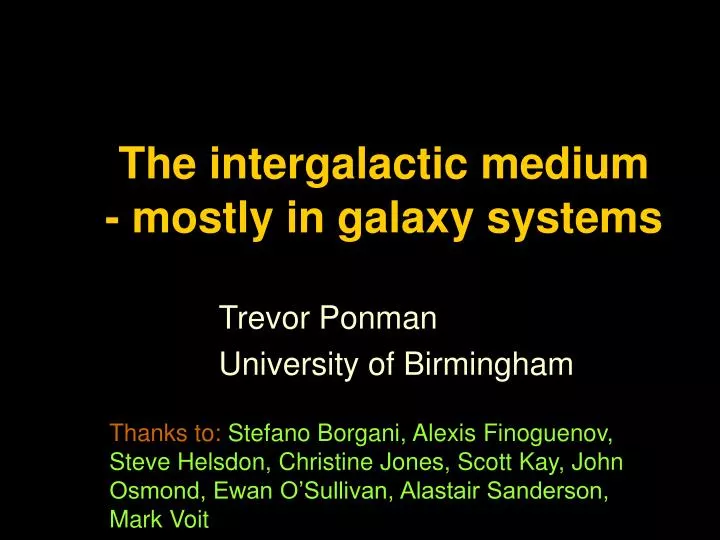
The intergalactic medium. - mostly in galaxy systems. Trevor Ponman University of Birmingham. Thanks to: Stefano Borgani, Alexis Finoguenov, Steve Helsdon, Christine Jones, Scott Kay, John Osmond, Ewan O’Sullivan, Alastair Sanderson, Mark Voit. Flow chart - evolution & feedback. Collapse &

E N D
The intergalactic medium - mostly in galaxy systems Trevor Ponman University of Birmingham Thanks to: Stefano Borgani, Alexis Finoguenov, Steve Helsdon, Christine Jones, Scott Kay, John Osmond, Ewan O’Sullivan, Alastair Sanderson, Mark Voit
Flow chart - evolution & feedback Collapse & hierarchical growth Stripping & strangulation IGM Galaxies Feedback (energy & metals)
The IGM • The baryon contribution to is constrained (e.g. by WMAP and Big Bang nucleosynthesis studies) to be b0.045 h70-2. • This corresponds to mean density b2.5x10-7 amu cm-3. • Gas with density <10-5 cm-3 can currently only be studied in absorption.
The IGM at low redshift At z~2-4 most of the baryons appear to reside in the Lyman- absorption systems, with T~30000 K. These also contain metals, with abundances up to ~0.1 solar. Simulations suggest that the Lyman forest “clouds” are filamentary structures, photoionized by UV flux from stars and AGN. Colder gas is concentrated into galaxies.
The IGM at low redshift The density of forest clouds drops sharply over the range z=3 to 1.5 Simulations predict that at low z, most of the IGM has been driven to higher temperatures, by shock heating in collapsing filaments.
The IGM at low redshift Most of the IGM is left in the “Warm-Hot Intergalactic Medium”, with T~105-106 K. Detection of this is very challenging! (cf talk by Fabrizio Nicastro) Dave et al 2001
The IGM in collapsed systems Virialised systems have overdensities />100, allowing emission from hot baryons to be detected. Compression & shocks during collapse and virialisation heats most baryons in groups and clusters of galaxies to T>106 K. X-ray emission XMM mosaic of MKW4, with optical contours - see O’Sullivan et al 2003
The IGM in collapsed systems Even some very poor groups, with low velocity dispersions, have detectable intergalactic X-ray emission. E.g. Chandra study of the NGC 1587 group, which has only ≈100 km s-1. Helsdon et al 2004
The IGM in collapsed systems Cosmological simulations including gravity and simple gas physics produce dark halos which are almost self-similar, when scaled to a radius enclosing fixed overdensity (e.g. r200). Also, gas tracks dark matter within these halos. This behaviour would generate clusters with well-defined X-ray scaling relations. For fixed z: ‹›~M/R3 is same for all systems T~M/R ~ R2 ~ M2/3 from V.T. r200~T1/2 LX~ 2·V·(T) ~ 2·T3/2·(T) where (T) ~ T1/2 for bremss, LX~T2 (Navarro et al 1995)
Mulchaey 2000 The L:T relation It has been clear for many years that the cluster L:T relation does not follow the LT2 slope expected for self-similar systems. In practice, LT3 for clusters, with possible further steepening to LT4 in group regime (notwithstanding recent result of slope 2.5 in GEMS group sample by Osmond & Ponman 2004!). What is causing this effect?
Ponman, Cannon & Navarro 1999 X-ray surface brightness Overlay of scaled X-ray surface brightness profiles shows that emissivity (hence gas) is suppressed and flattened in cool (T<4 keV) systems, relative to hot ones.
Entropy in the intracluster medium • It is helpful to consider the entropy of the ICM: • Gas will always rearrange itself such that entropy increases outward • Entropy is conserved in any adiabatic rearrangement of gas Entropy map of NGC 4325 group - Finoguenov
Non-radiative simulations produce clusters with self-similar entropy profiles K(r)=aT (r/r200)1.1 Voit, Kay & Bryan 2004 Entropy in the intracluster medium • It is helpful to consider the entropy of the ICM: • Gas will always rearrange itself such that entropy increases outward • Entropy is conserved in any adiabatic rearrangement of gas • Define “entropy” as K=T/n2/3 • (so true thermodynamic entropy is s=k ln K + s0 .)
Entropy floor Self-similar scaling Entropy in the ICM Ponman et al. (1999) & Lloyd-Davies et al (2000)studied ROSAT and ASCA data for a sample of clusters core entropy appeared to show a “floor” at ~100-150 keV cm2 at r=0.1 r200 .
KT Entropy in the ICM A larger study, of 66 systems by Ponman, Sanderson & Finoguenov (2003), now indicates that there is not a “floor” but a “ramp”, with K(0.1r200) scaling as KT2/3, rather than the self-similar scaling of KT.
Entropy in the ICM Recent work by Pratt & Arnaud, Sun et al and Finoguenov confirms the lack of isentropic cores with higher quality data from XMM and Chandra. The KT2/3 scaling is also confirmed, but there is more scatter in entropy for cooler (<2 keV) systems. Sun et al 2004
Entropy floor Self-similar scaling Feedback and entropy Voit & Bryan (2001) pointed out that for T<2 keV, contours of constant entropy correspond approximately to lines of constant cooling time.
Voit & Bryan 2001 Feedback and entropy Voit & Bryan (2001) pointed out that for T<2 keV, contours of constant entropy correspond approximately to lines of constant cooling time. Hence low K gas should be removed from clusters either by cooling, or by being heated due to nearby feedback processes fueled by neighbouring cooling regions.
Feedback and entropy The cooling threshold approach can also reproduce the observed KT2/3 behaviour in cluster cores reasonably well. Voit & Ponman 2004
Feedback and entropy The entropy threshold approach can also reproduce the observed KT2/3 behaviour in cluster cores reasonably well. And the L:T relation is quite well modelled, at least above T~1 keV. Voit et al 2002
Borgani et al 2004 Feedback simulations Cosmological simulations including feedback have been carried out by Borgani & coworkers, and by Kay. It is difficult to reproduce the observed properties (L:T, S:T, M:T, S(r), fgas, fit etc.) in a single scheme.
Feedback simulations Perhaps the most intriguing result so far from this work is the strong feedback model of Kay (2004), which manages to reproduce the S(T) slope at both 0.1r200 and at r500 remarkably well, with a feedback scheme which involves heating gas around “star particles” to 1000 keV cm2! The net energy input is still reasonable for supernova feedback, however, at ~1 keV per particle. r500 0.1r200 Kay 2004
Metallicity in clusters often shows a central enhancement, outside which it drops to 0.2-0.3 solar. • Recent XMM results (e.g. Pratt & Arnaud) confirm these features. • The central peak may be plausibly explained by ejecta from the central galaxy - with predominantly SNIa origin (lower O/Fe). Beppo-SAX abundances for CF and non-CFclusters Molendi 2004 Metal abundances in the ICM
Are abundances in groups lower? A montage of group abundance profiles from Chandra (Helsdon) suggests that they drop to ~0.1 solar outside the core region (cf Buote et al 2004 study of NGC5044).
Cooling of the ICM Cooling appears to be taking place in the cores of many groups and clusters.
Cooling of the ICM Cooling appears to be taking place in the cores of many groups and clusters. Cooling times in most cluster cores are «tH. Fabian 2004
Cooling of the ICM However, gas cooling to T≈0 produces a characteristic set of emission lines. Peterson et al 2003
Cooling of the ICM …and high resolution spectroscopy with XMM and Chandra has failed to find lines corresponding to very cool gas. Peterson et al 2003
Cooling of the ICM The conclusion seems to be that gas cools by a factor ~3 from its peak temperature, but little or no gas cools below this point. If this is the case, then the heating rates required to counteract cooling are substantial. Fabian 2004
Heating of the ICM So - we appear to have two “heating problems: Heating required to break self-similarity in baryonic components of groups & clusters Heating needed to counteract cooling within cluster cores. What heat sources are available?
Heating of the ICM - mergers Very large amounts of energy (>1063 erg) can be released in cluster mergers, but: Only a minority of clusters are strongly affected at a given time. Merger shocks would not break self-similarity. T (keV) Govoni et al 2004
Heating of the ICM - supernovae Star formation, and the resulting supernova explosions, potentially provides up to ~1 keV per particle of energy, given the observed Si abundance in the ICM (Finoguenov et al 2001). This might be enough to account for the similarity breaking. However, there is little active star formation in cluster cores today, so this process cannot solve the cooling flow problem. Deep Chandra observation of the Antennae - Fabbiano et al 2004
In many cases this seems to be associated with activity in a central active galaxy. VLA 1.4 GHz contours Heating of the ICM - AGN Chandra has uncovered complex structures within the cores of many groups & clusters Chandra observation of the NGC 4636 group
Heating of the ICM - AGN In M87, a 137 ksec Chandra exposure, reveals arms and shock-like arcs. Christine Jones - see also Forman et al 2004
Heating of the ICM - AGN In M87, a 137 ksec Chandra exposure, reveals arms and shock-like arcs. Energy input from uplifted gas and shocks - totalling >1059 erg. VLA image showing structures on 3 different scales Owen et al 2000
Ripples in the surrounding ICM appear to be sound waves, which may provide distributed heating. Simulations of viscous dissipation of sound waves - Ruszkowski et al 2004 Unsharp masked image Heating of the ICM - AGN The Perseus cluster shows a series of AGN-generated cavities. Core of the Perseus cluster - Fabian et al 2003
X-ray bright groups Mulchaey 2000 Effects of the ICM on galaxies Most galaxies reside within groups, and there is clearly a relationship between galaxy and IGM properties. For example, almost all groups with a detectable hot IGM have an early-type central galaxy.
Dressler clusters Groups Effects of the ICM on galaxies And galaxies within groups show a morphology-density relation much like those in clusters - but stronger. Groups scaled for interaction rate These environmental effects could result from galaxy-gas or galaxy-galaxy interactions. Groups scaled to 3D density
Chandra emission (blue/green) superimposed on V band image (red). C153 Effects of the ICM on galaxies Clear examples of ram pressure stripping of galactic gas by hydrodynamical interaction with the ICM are not common. A recent example is the active disk-like galaxy C153, moving at v>1500 km s-1 through the complex merging cluster A2125 (Wang et al 2004).
Effects of the ICM on galaxies Hydrodynamical simulations of ram pressure stripping can reproduce such effects (e.g. Stevens et al 1999), but the rarity of X-ray bright examples suggests that these may arise from galaxies experiencing a first infall into a cluster (Acreman et al 2003). See talk by Irini Sakelliou.
E.g. intergalactic shocks in Stephan’s Quintet (Trinchieri et al 2003) – due to collision of infalling galaxy with existing stripped HI? The impact of group collapse The collapse and virialisation of galaxy groups produces a violent environment which can affect group galaxies.
The impact of group collapse The collapse and virialisation of galaxy groups produces a violent environment which can affect group galaxies. XMM study of the unusual X-ray bright group around NGC 5171 (Osmond et al 2003). Highest LX system in GEMS study of 60 groups in which X-ray emission is not centred on a dominant early-type galaxy.
Metal rich central filament Hot shocked region to W The impact of group collapse NGC 5171 It appears that gas is being stripped from the central galaxies as two subgroups merge.
Summary • Feedback has affected the IGM in groups and clusters. • Energy input from Sne and AGN are likely to be important. • Neither is yet well understood or modelled. • Collapse and merging of groups may impact significantly on their galaxies. • There may be emerging evidence that integrated abundances are lower in groups than in clusters - what is this telling us?
Outline of talk • The IGM at large • The IGM in collapsed systems • Cooling in the IGM • Heating of the IGM • Effects of the IGM on galaxies • Some questions
Osmond & Ponman 2004 slope=2.50 L:T relation – does it steepen? From the GEMS sample of 35 groups selected to have intergalactic hot gas, and with LX extrapolated to r500, from ROSAT data, Osmond & Ponman obtained an L:T slope of 2.50.4 – no steeper than for clusters.
L:T relation – does it steepen? Further investigation (Helsdon & Ponman) shows that this result was misleading. With highly scattered data: a) Don’t use a bisector approach! b) Beware of the effects of flux limits. Orthogonal regression slope=3.53 Simulated data
Orthogonal regression slope=3.53 Orthogonal regression with binning slope=3.87 0.50 Osmond & Ponman 2004 slope=2.50 L:T relation – does it steepen? So – L:T probably does steepen, from 3 to 4.
KT Entropy in the ICM It was also found that this KT2/3 scaling applied at larger radii (e.g. r500), and that K(r) profiles rise approximately linearly with r, with no large isentropic core, for systems right across the range T1-13 keV. Ponman, Sanderson & Finoguenov 2003