Download
1 / 19
190 likes | 294 Views
Project 0-4193/0-4194 Watershed Properties for Regionalization. Ted Cleveland, UH Xin He, UH. Background. Each station in the database was considered as an “outlet” for a watershed. U.S.G.S. 7.5’ Topographic Quadrangle maps were used at the data source for the measurements.

E N D
Project 0-4193/0-4194Watershed Properties for Regionalization Ted Cleveland, UH Xin He, UH
Background • Each station in the database was considered as an “outlet” for a watershed. • U.S.G.S. 7.5’ Topographic Quadrangle maps were used at the data source for the measurements. • Original maps were obtained from the University of Houston Library, and 1:1 photocopied onto large width sheets. • The characteristics were selected/invented to reflect the kind of measurements that would be available to any civil engineer and are thought to convey some hydrologic behavior. • Traditionally area, distance, and slopes are hydrologically important.
Station Location • Station location is determined by the latitude and longitude reported in the station_id data file. • These latitudes and longitudes are plotted on the paper maps using linear interpolation between the latitude and longitude increments actually marked on the map. • The interpolation weights are written on each paper copy because the latitude and longitude distances are different. • The interpolation distances are plotted using an engineer scale, typically the 1/50 scale. • Once the station is plotted the location is confirmed by using geo-referenced images of the U.S.G.S. maps displayed at www.topozone.com.
Adjustments of Locations (for measuring only) • Engineering judgment is used to locate the station for determining drainage area, for instance if the location is near a road and a stream channel, we locate the “outlet” in the stream channel adjacent to the road at the grade separation (bridge or culvert). • If the location is somewhere in the middle of nowhere, we try to identify the nearest stream channel or topographic feature that makes sense from a runoff path point of view. • Most of the station locations made sense without appealing to such inference adjustments (Deep Creek 08140000 is a notable exception).
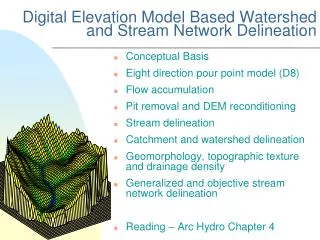
Drainage-Area Delineation • Once the outlet is located the watershed is delineated in a trial and error fashion. • Details on the manual delineation procedures are in a methods report stored on balrog.
Area Measurements • The marked area is measured and compared to the area in the station_id file using a mechanical planimeter. • We adjust the boundary until the mechanical result and the station_id file differ by less than 10%. • When reducing or adding area in the drawn boundary, use of engineering judgement is required. • As a guideline, we move the boundary in relatively flat areas (if they exist) because flow direction is hard to determine anyway. • In most cases adjustments were relatively minor to achieve the required area match. • The area is recorded in square miles.
Perimeter • Navigation dividers are used to determine the perimeter of the drainage area by counting the number of known increments required to traverse the perimeter (solid line drawn on the map). • The watersheds adopt a relatively consistent shape, intermediary between ovoid and pear shaped. • Typically we set the divider at 5 cm, and count the numbers of this unit length along with outline of the watershed, the count number multiplied by 5 cm is then transferred into the perimeter of the watershed using the map scale. • The value is recorded in units of feet.
Stream-length • The length the main stream is determined in a two part process. First the stream is drawn using a colored highlighter and Horton’s rules for navigating bifurcations. • Specifically, to delineate the main stream at bifurcation the following rules were used: • a) Starting below the junction, the main stream was projected upstream from the bifurcation in the same direction. The stream joining the main stream at the greatest angle was the lower order. • b) If both streams were at about the same angle to the main stream at the junction, the shorter was taken as the lower order. • Once the lowest order stream is marked, navigation dividers are used in the same fashion as for perimeter. • The value is recorded in units of feet.
Max-distance • The maximum distance is the straight-line distance from the station location to the furthest point of the drainage area. • A string-type compass is used to locate on the watershed boundary the point furthest from the outlet (without regard to flow path). • A straightedge is used to join these two points, and then the distance along this line segment is measured with the navigation dividers. • The value is recorded in units of feet.
NS-Range • The width of the watershed from the most north point to the most south point. A rectangle is drawn that encloses the watershed. • The NS-Range is the NS dimension of this rectangle. • The unit of the NS-range is feet.
EW-Range: • The width of the watershed from the most east point to the most west point. A rectangle is drawn that encloses the watershed. • The EW-Range is the EW dimension of this rectangle. • The unit of the EW-range is feet.
Hi-elevation • The highest elevation within the watershed. • Read from the topographic maps. • The unit is feet.
Low-elevation • The lowest elevation within the watershed – typically this should be at the outlet. • Read from the topographic maps. • The unit is feet.
Max-distance • NS-High point elevation: The highest elevation of the watershed along a North-South line. It typically will be at the North or South intersection of the NS-EW rectangle that encloses the watershed. Read from the topographic maps. The unit is feet.
NS-Range: • The width of the watershed from the most north point to the most south point. A rectangle is drawn that encloses the watershed. • The NS-Range is the NS dimension of this rectangle. • The unit of the NS-range is feet.
EW-High point elevation • The highest elevation of the watershed along an East-West line. It will typically be at the East or West intersection of the NS-EW rectangle that encloses the watershed. Read from the topographic maps. • The unit is feet.
EW-Low point elevation • The lowest elevation of the watershed along an East-West line. It will typically be at the East or West intersection of the NS-EW rectangle that encloses the watershed. Read from the topographic maps. • The unit is feet.
Database Structure • The watersheds database is organized into a single flat file in MS Excel. • It is also saved as an ASCII comma-delimited file. • Figure 3 is an example of the first few records of the watersheds database. • The file names are : • watersheds_data.xls • watersheds_data.dat