Download
1 / 10
100 likes | 211 Views
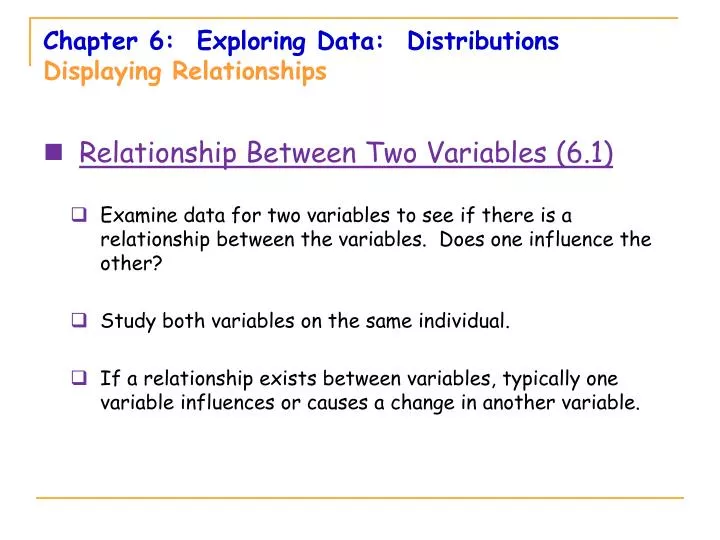
Chapter 6: Exploring Data: Distributions Displaying Relationships. Relationship Between Two Variables (6.1) Examine data for two variables to see if there is a relationship between the variables. Does one influence the other? Study both variables on the same individual.

E N D
Chapter 6: Exploring Data: DistributionsDisplaying Relationships • Relationship Between Two Variables (6.1) • Examine data for two variables to see if there is a relationship between the variables. Does one influence the other? • Study both variables on the same individual. • If a relationship exists between variables, typically one variable influences or causes a change in another variable.
Chapter 6: Exploring Data: DistributionsDisplaying Relationships • Explanatory variable explains or causes the changein another variable (INPUT). • Response variable measures the outcome or response to the change (OUTPUT). What are some variables that you feel have a relationship? Does one explain the other or do you believe one is in responseto the other?
Example For the following situations, is it more reasonable to simply explore a relationship between the two variables or to view one variable as the explanatory variable, x, and the other as the response, y? a) Average of parents’ height and the height of their child. b) The number of words on a page and the thickness of the book. c) Shoe size and the age of a child.
Example a) Average of parents’ height and the height of their child. Explanatory (x) ~ Parents’ height. Response (y) ~ their child’s height. The parents’ height EXPLAINS or CAUSES the child’s height. The height of a child is in RESPONSE to the parents’ height.
Example b) The number of words on a page and the thickness of the book. Relationship only. One does not CAUSE the other. c) Shoe size and the age of a child. Explanatory (x) ~ age of a child Response (y) ~ the child’s shoe size.
Chapter 6: Exploring Data: DistributionsDisplaying Relationships: Scatterplots (6.2) • Data to Be Used for a Scatterplot • A scatterplot is a graph that shows the relationship between two numerical variables, measured on the same individual. • Explanatory variable, x, is plotted on the horizontal axis, (x). • Response variable, y, is plotted on the vertical axis (y). • Each pair of related variables (x, y) is plotted on the graph. 6
Example:A study done to see how the number of beers that a young adult drinks predicts his/her blood alcohol content (BAC). Results of 16 people: Explanatory Variable (x) ~ x = beers drunk Response Variable (y) ~ y = BAC level
Chapter 6: Exploring Data: DistributionsDisplaying Relationships: Scatterplots • Scatterplot • Example continued: The scatterplot of the blood alcohol content, BAC, (y, response variable) against the number of beers a young adult drinks (x, explanatory variable). • The data from the previous table are plotted as points on the graph (x, y). BAC vs. number of beers consumed 8
Examining This Scatterplot… 1. What is the overall pattern (form, direction, and strength)? • Form – Roughly a straight-line pattern. • Direction – Positive association (both increase). • Strength – Moderately strong (mostly on line). BAC vs. number of beers consumed Outliers – A deviation in a distribution of a data point falling outside the overall pattern. 2. Any striking deviations (outliers)? Not here.
Homework: P. 242-244, #1-3,6 This problem needs to be graphed; No scatter plot – no credit for homework.