Download
1 / 9
100 likes | 229 Views
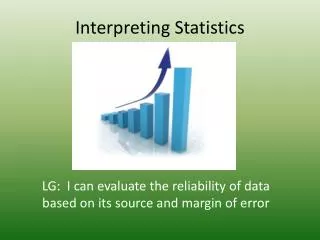
Interpreting Statistics. Tables. A table is used to write down a number of pieces of data about different things. Tables are one of the most basic way of representing data but are not always easy to interpret. Tally Marks. Tally marks are used for counting things. Pictograms.

E N D
Tables A table is used to write down a number of pieces of data about different things. Tables are one of the most basic way of representing data but are not always easy to interpret.
Tally Marks Tally marks are used for counting things.
Pictograms The key shows that 2 bikes are represented by a picture of a wheel. So half a wheel must represent 1 bike.
Pie Charts Pie charts are circles divided into segments, where each segment represents a fraction of the total amount. This pie chart shows the 20 bikes sold at the bike shop. The segment for Mountain bikes is one half of the chart. This is because 10 Mountain bikes were sold, which is exactly half the number of bikes sold in total (20 bikes).
The angle in this segment is 90o Pie Chart Calculations Therefore this segment represents 90/360 or 1/4 of the total number of bikes sold. If a total of 20 bikes were sold then 5 of them were Outdoor
Bar Charts The heights of the bars in this bar chart show how many of each bike were sold. e.g. 3 Ranger bikes were sold today
Line Graphs A line graph is used to show how one quantity changes with another. This line graph is showing how the temperature of a hot drink changed over time.