Download
1 / 34
340 likes | 423 Views
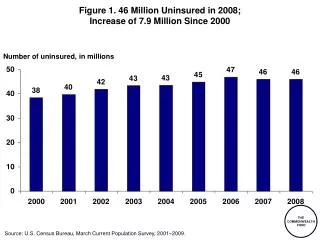
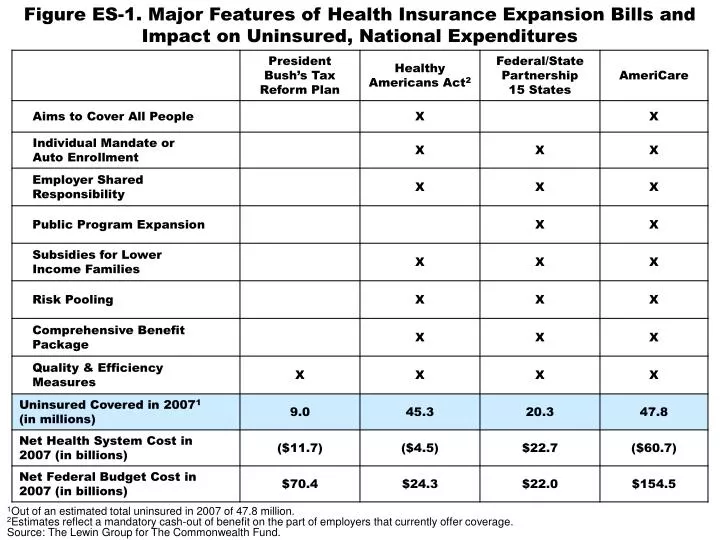
Figure ES-1. Major Features of Health Insurance Expansion Bills and Impact on Uninsured, National Expenditures. 1 Out of an estimated total uninsured in 2007 of 47.8 million. 2 Estimates reflect a mandatory cash-out of benefit on the part of employers that currently offer coverage.

E N D
Figure ES-1. Major Features of Health Insurance Expansion Bills and Impact on Uninsured, National Expenditures 1Out of an estimated total uninsured in 2007 of 47.8 million. 2Estimates reflect a mandatory cash-out of benefit on the part of employers that currently offer coverage. Source: The Lewin Group for The Commonwealth Fund.
Figure ES-2. U.S. Population by Primary Source of Insurance, 2007 Healthy Americans Act Current Law Uninsured 2.5 (1%) Uninsured 47.8 (16%) Medicare 31.9 (11%) Dual Eligible 8.0 (3%) Employer 153.7 (52%) HAA Coverage 248.8 (84%) Medicaid/ SCHIP 37.5 (13%) CHAMPUS 3.9 (1%) Dual Eligible 8.0 (3%) President Bush’s Tax Reform Plan AmeriCare Medicare 31.9 (11%) Dual Eligible 8.0 (3%) Medicare 31.9 (11%) Uninsured 38.8 (13%) CHAMPUS 3.4 (1%) Employer 145.2 (49%) CHAMPUS 3.4 (1%) Employer Retiree 3.3 (1%) Employer 5.0 (2%) Private Non-Employer 9.5 (3%) Medicaid/ SCHIP 38.5 (13%) Medicare 39.9 (14%) AmeriCare 246.8 (83%) CHAMPUS 3.4 (1%) Private Non-Employer 29.3 (10%) Total population = 295.1 million Source: The Lewin Group for The Commonwealth Fund.
Figure ES-3. Health Insurance Expansion BillsChange in Health Spending by Stakeholder Group, Billions of Dollars, 2007 1Out of an estimated total uninsured in 2007 of 47.8 million. 2Estimates reflect a mandatory cash-out of benefits on the part of employers that currently offer coverage. Source: The Lewin Group for The Commonwealth Fund.
Figure ES-4. Change in Average Family Health Spending Under the AmeriCare Health Act in 2007, by Income Group Less than $10,000– $20,000– $30,000– $40,000– $50,000– $75,000– $100,000– $150,000 $10,000 $19,000 $29,999 $39,999 $49,999 $74,999 $99,999 $149,999 & Over Source: The Lewin Group for The Commonwealth Fund.
Figure ES-5. Change in Average Family Health Spending Under the Healthy Americans Act in 2007, by Income Group Less than $10,000– $20,000– $30,000– $40,000– $50,000– $75,000– $100,000– $150,000– $175,000– $250,000 $10,000 $19,999 $29,999 $39,999 $49,999 $74,999 $99,999 $149,999 $174,999 $249,999 & Over Note: Estimates reflect a mandatory cash-out of benefits on the part of employers that currently offer coverage. Source: The Lewin Group for The Commonwealth Fund.
Figure ES-6. Change in Average Family Health Spending Under President Bush’s Health Care Tax Reform Proposal in 2007,by Income Group Less than $10,000– $20,000– $30,000– $40,000– $50,000– $75,000– $100,000– $150,000 $10,000 $19,999 $29,999 $39,999 $49,999 $74,999 $99,999 $149,999 & Over Family Income Source: The Lewin Group for The Commonwealth Fund.
Figure ES-7. Major Features of Health Insurance Expansion Bills and Impact on Uninsured, National Expenditures 1Out of an estimated total uninsured in 2007 of 47.8 million. Source: The Lewin Group for The Commonwealth Fund.
Figure ES-8. Health Insurance Expansion Bills Change in Health Spending by Stakeholder Group, Billions of Dollars, 2007 1Out of an estimated total uninsured in 2007 of 47.8 million. Source: The Lewin Group for The Commonwealth Fund.
Figure ES-9. Major Features of Health Insurance Expansion Bills and Impact on Uninsured, National Expenditures 1Out of an estimated total uninsured in 2007 of 47.8 million. 2Modeling assumed that firms with under 100 employees are eligible; reinsurance of 90% of costs over $50,000. Source: The Lewin Group for The Commonwealth Fund.
Figure ES-10. Health Insurance Expansion BillsChange in Health Spending by Stakeholder Group, Billions of Dollars, 2007 1Out of an estimated total uninsured in 2007 of 47.8 million. 2Modeling assumed that firms with under 100 employees are eligible; reinsurance of 90% of costs over $50,000. Source: The Lewin Group for The Commonwealth Fund.
Figure ES-11. Major Features of Health Insurance Expansion Bills 1Out of an estimated total uninsured in 2007 of 47.8 million. 2Estimated to cover 86% of the 23.6 million people projected to be uninsured in the 15 states in 2007. Source: The Lewin Group for The Commonwealth Fund.
Figure 1. Major Features of Health Insurance Expansion Bills and Impact on Uninsured, National Expenditures 1Out of an estimated total uninsured in 2007 of 47.8 million. 2Estimates reflect a mandatory cash-out of benefit on the part of employers that currently offer coverage. Source: The Lewin Group for The Commonwealth Fund.
Figure 2. Distribution of People by Primary Source of Coverage Under Current Law and President Bush’s Health Care Tax Reform Proposal, 2007 Current Law (millions) Proposal (millions) Uninsured 38.8 (13%) Uninsured 47.8 (16%) Employer 157.0 (53%) Employer 145.2 (49%) Medicaid/ SCHIP 38.5 (13%) Medicaid/ SCHIP 37.5 (13%) Medicare 39.9 (14%) Medicare 39.9 (14%) CHAMPUS 3.4 (1%) Private Non-Employer 29.3 (10%) CHAMPUS 3.4 (1%) Private Non-Employer 9.5 (3%) Total population = 295.1 million Source: The Lewin Group for The Commonwealth Fund.
Figure 3. President Bush’s Health Care Tax Reform Proposal Projected Increases in Average Family Health Insurance Premium and Cap on Tax Deductions Source: Commonwealth Fund calculations based on a 7.5% rate of increase in premiums and a 2.8% rate of increase in cap on tax deduction. Based on employer share of family premium.
Figure 4. Health Insurance Expansion BillsChange in Health Spending by Stakeholder Group, Billions of Dollars, 2007 1Out of an estimated total uninsured in 2007 of 47.8 million. 2Estimates reflect a mandatory cash-out of benefits on the part of employers that currently offer coverage. Source: The Lewin Group for The Commonwealth Fund.
Figure 5. Change in Average Family Health Spending Under President Bush’s Health Care Tax Reform Proposal in 2007,by Income Group Less than $10,000– $20,000– $30,000– $40,000– $50,000– $75,000– $100,000– $150,000 $10,000 $19,999 $29,999 $39,999 $49,999 $74,999 $99,999 $149,999 & Over Family Income Source: The Lewin Group for The Commonwealth Fund.
Figure 6. U.S. Population by Primary Source of Insurance, Under Current Law and the Healthy Americans Act, 2007 Under Healthy Americans Act Current Law Uninsured 2.5 (1%) Medicare 31.9 (11%) Dual Eligible 8.0 (3%) Uninsured 47.8 (16%) Employer 153.7 (52%) CHAMPUS 3.9 (1%) Medicaid/ SCHIP 37.5 (13%) Dual Eligible 8.0 (3%) Medicare 31.9 (11%) HHA Coverage 248.8 (84%) CHAMPUS 3.4 (1%) Employer Retiree 3.3 (1%) Private Non-Employer 9.5 (3%) Total population = 295.1 million Source: The Lewin Group for The Commonwealth Fund.
Figure 7. Change in Average Family Health Spending Under the Healthy Americans Act in 2007, by Income Group Less than $10,000– $20,000– $30,000– $40,000– $50,000– $75,000– $100,000– $150,000– $175,000– $250,000 $10,000 $19,999 $29,999 $39,999 $49,999 $74,999 $99,999 $149,999 $174,999 $249,999 & Over Note: Estimates reflect a mandatory cash-out of benefits on the part of employers that currently offer coverage. Source: The Lewin Group for The Commonwealth Fund.
Figure 8. U.S. Population by Primary Source of CoverageUnder Current Law and the 15-State Scenario in 2007:For Affected States Only (millions) Current Law (millions) Proposal (millions) Uninsured 3.3 (2%) Purchasing Pool 11.7 (8%) Uninsured 23.6 (16%) Employer 80.6 (55%) Employer 84.7 (58%) Medicaid/ SCHIP 25.8 (18%) Medicaid/ SCHIP 18.5 (13%) Medicare/ Medicaid Dual 3.6 (2%) Medicare/ Medicaid Dual 3.6 (2%) Medicare 15.2 (10%) Medicare 15.2 (10%) CHAMPUS 1.6 (1%) CHAMPUS 1.6 (1%) Non-Group 4.0 (3%) Non-Group 1.3 (1%) Total population = 147.2 million Note: Average monthly coverage. Primary payer is determined on basis of current prevailing coordination of benefits practices. Source: The Lewin Group for The Commonwealth Fund.
Figure 9. Distribution of People by Primary Source of Coverage Under Current Law and the AmeriCare Health Act in 2007 Current Law (millions) Proposal (millions) Dual Eligible 8.0 (3%) Medicare 31.9 (11%) Uninsured 47.8 (16%) CHAMPUS 3.4 (1%) Employer 157.0 (53%) Employer 5.0 (2%) Medicaid/ SCHIP 37.5 (13%) Dual Eligible 8.0 (3%) Medicare 31.9 (11%) AmeriCare 246.8 (83%) CHAMPUS 3.4 (1%) Private Non-Employer 9.5 (3%) Total population = 295.1 million Note: Average monthly coverage. Primary payer is determined on basis of current prevailing coordination of benefits practices. Source: The Lewin Group for The Commonwealth Fund.
Figure 10. Changes in National Health Spending Under the AmeriCare Health Act in 2007 (in Billions) 1Assumes 40% of change in provider payment rates is passed on to health plans. 2Assumes eligibility determination expense of $171 per application, which is based upon the average cost of eligibility determination programs in New York. Source: The Lewin Group for The Commonwealth Fund.
Figure 11. Change in Average Family Health Spending Under the AmeriCare Health Act in 2007, by Income Group Less than $10,000– $20,000– $30,000– $40,000– $50,000– $75,000– $100,000– $150,000 $10,000 $19,000 $29,999 $39,999 $49,999 $74,999 $99,999 $149,999 & Over Source: The Lewin Group for The Commonwealth Fund.
Figure 12. Major Features of Health Insurance Expansion Bills and Impact on Uninsured, National Expenditures 1Out of an estimated total uninsured in 2007 of 47.8 million. Source: The Lewin Group for The Commonwealth Fund.
Figure 13. Estimated Number of People Who Will Enroll in the Medicare Buy-In Program Current (millions) Proposal (millions) Uninsured 4.8 (16%) Medicare Buy-In 7.1 (24%) Employer Sponsored (Workers) 16.3 (55%) Employer Sponsored (Workers) 16.3 (55%) Employer Sponsored (Retiree) 2.7 (9%) Uninsured 1.3 (4%) Employer Sponsored (Retiree) 0.5 (2%) Medicaid 1.6 (5%) Medicare 1.9 (6%) Medicaid 1.6 (5%) CHAMPUS 0.8 (3%) Medicare 1.9 (6%) Individually Purchased 1.5 (5%) CHAMPUS 0.8 (3%) All adults ages 55–64 = 29.5 million Source: The Lewin Group for The Commonwealth Fund.
Figure 14. Health Insurance Expansion Bills Change in Health Spending by Stakeholder Group, Billions of Dollars, 2007 1Out of an estimated total uninsured in 2007 of 47.8 million. Source: The Lewin Group for The Commonwealth Fund.
Figure 15. Disabled People in the Waiting Period for Medicarein 2007, by Source of Coverage Uninsured 264,504 (15%) Medicaid 644,520 (37%) Non-Group 150,121 (9%) Employer 567,501 (33%) CHAMPUS 106,697 (6%) Total people currently in waiting period = 1,733,343 Note: Number of people in the waiting period was estimated using the number of SSDI awards to disabled workers, widowers and adult children in 2004 and 2005 from the Social Security Administration Annual Statistical Supplement (2005 and 2006). Source: The Lewin Group for The Commonwealth Fund.
Figure 16. Poverty Distribution of Uninsured Children Under Age 21, In Millions, 2007 <100% of poverty 2,692 (24%) 300%+ of poverty 3,524 (32%) 100–149% of poverty 1,393 (13%) 200–299% of poverty 2,138 (19%) 150–199% of poverty 1,354 (12%) Total uninsured children under age 21 = 11,101,000 Source: The Lewin Group for The Commonwealth Fund.
Figure 17. Estimated Effect of Kids Come First Act on Uninsured Children in 2007 (in 1,000s) Private 901 (8%) Over 300% FPL 2,360 (21%) Covered Under New Program 5,202 (47%) Remain Uninsured 5,899 (53%) Eligible for Expansions 1,738 (16%) SCHIP 4,301 (39%) Eligible Medicaid/ SCHIP 1,193 (11%) Undocumented 608 (5%) All uninsured children under age 21 (current law): 11,101,000 Source: The Lewin Group for The Commonwealth Fund.
Figure 18. Distribution of People by Primary Source of Coverage Under Current Law and the Kids Come First Act, 2007 Current Law (millions) Proposal (millions) Uninsured 42.6 (14%) Uninsured 47.8 (16%) Employer 157.0 (53%) Employer 151.0 (52%) Medicaid/ SCHIP 48.3 (16%) Medicaid/ SCHIP 37.5 (13%) Dual Eligible 8.0 (3%) Dual Eligible 8.0 (3%) Medicare 31.9 (11%) Medicare 31.9 (11%) CHAMPUS 3.4 (1%) CHAMPUS 3.4 (1%) Private Non-Employer 9.5 (3%) Private Non-Employer 9.9 (3%) Total population = 295.1 million Note: Average monthly coverage. Primary payer is determined on basis of current prevailing coordination of benefits practices. Source: The Lewin Group for The Commonwealth Fund.
Figure 19. Distribution of People by Primary Source of Coverage Under Current Law and the Family Care Act, 2007 Current Law (millions) Proposal (millions) Uninsured 41.6 (14%) Uninsured 47.8 (16%) Employer 157.0 (53%) Employer 155.8 (53%) Medicaid/ SCHIP 45.2 (15%) Medicaid/ SCHIP 37.5 (13%) Dual Eligible 8.0 (3%) Dual Eligible 8.0 (3%) Medicare 31.9 (11%) Medicare 31.9 (11%) CHAMPUS 3.4 (1%) CHAMPUS 3.4 (1%) Private Non-Employer 9.5 (3%) Private Non-Employer 9.2 (3%) Total population = 295.1 million Note: Average monthly coverage. Primary payer is determined on basis of current prevailing coordination of benefits practices. Source: The Lewin Group for The Commonwealth Fund.
Figure 20. Major Features of Health Insurance Expansion Bills and Impact on Uninsured, National Expenditures 1Out of an estimated total uninsured in 2007 of 47.8 million. 2Modeling assumed that firms with under 100 employees are eligible; reinsurance of 90% of costs over $50,000. Source: The Lewin Group for The Commonwealth Fund.
Figure 21. Distribution of People by Primary Source of Coverage Under Current Law and the Health Care for Working Families Act in 2007 Current Law (millions) Proposal (millions) Uninsured 35.5 (12%) Uninsured 47.8 (16%) Employer 157.0 (53%) Employer 181.7 (61%) Medicaid/ SCHIP 32.4 (11%) Medicaid/ SCHIP 37.5 (13%) Dual Eligible 8.0 (3%) Dual Eligible 8.0 (3%) Medicare 29.0 (10%) Medicare 31.9 (11%) CHAMPUS 1.7 (1%) CHAMPUS 3.4 (1%) Private Non-Employer 6.8 (2%) Private Non-Employer 9.5 (3%) Total population = 295.1 million Note: Average monthly coverage. Primary payer is determined on basis of current prevailing coordination of benefits practices. Source: The Lewin Group for The Commonwealth Fund.
Figure 22. Health Insurance Expansion BillsChange in Health Spending by Stakeholder Group, Billions of Dollars, 2007 1Out of an estimated total uninsured in 2007 of 47.8 million. 2Modeling assumed that firms with under 100 employees are eligible; reinsurance of 90% of costs over $50,000. Source: The Lewin Group for The Commonwealth Fund.
Figure 23. Major Features of Health Insurance Expansion Bills 1Out of an estimated total uninsured in 2007 of 47.8 million. 2Estimated to cover 86% of the 23.6 million people projected to be uninsured in the 15 states in 2007. Source: The Lewin Group for The Commonwealth Fund.