Download
1 / 44
440 likes | 586 Views
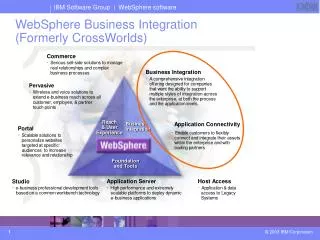
WebSphere Business Integration Monitor Technical Overview. huiyi@cn.ibm.com. Simple Integrated Development. Model. Proven Experience. Manage. Transform. Service Oriented Architecture. Secure & Scaleable. Interact. Integrate. Standards Leadership. Accelerate.

E N D
WebSphere Business Integration MonitorTechnical Overview huiyi@cn.ibm.com
SimpleIntegratedDevelopment Model ProvenExperience Manage Transform ServiceOrientedArchitecture Secure &Scaleable Interact Integrate StandardsLeadership Accelerate IBM Model / Monitor / Manage Delivers e-Business on-Demand Imagine that you could • describe a process • graphically model it • simulate the operations • make iterative changes to optimize results… …then rapidly deploy the process by • drawing relationships between data, people, systems and partners • identify and mark key business indicators • customize the solution for specific deployments • test your process and make sure that it runs as expected… …and, once in production, • watch your processes running in real time • quickly respond to alerts • make real-time decisions about process operations • collect, analyze and compare operationalperformance against the simulation… • Common Framework • Tooling • Business Objects • Adapter Framework • Services oriented architecture • Browser based GUIs …you can, today, with IBM WebSphere Business Integration
Business Integration Reference Architecture WebSphere Studio WebSphere BI Modeler Development Platform Business Performance Management Services WBI Monitor Interaction Services Process Services Information Services WebSphere BI Server WebSphere BI Server Foundation WebSphere Portal Server DB2 Information Integrator WebSphere MQ Web Services Gateway WBI Event/Message Broker Enterprise Service Bus WBI Adapters DB2 II Classic HATS Application and Data Access Services Business App Services Partner Services WebSphere BI Connect WebSphere Application Server Business Application and Data Services Enterprise Applications and Data Infrastructure Services
Agenda • Product Overview • Creating Business Measures • Integration Highlights • Product Directions
WBI Monitor Overview • Monitors Multiple Sources:Obtain process information from WebSphere MQWF, ICS, Message Broker and outside databases • No Coding Required:Business measures defined in WBI Workbench, then imported with process model into WBI Monitor directly, on-the-fly • Displays Process Performance:Track process performance in real-time • Decision-Making Tool:Base decisions on performance data and resolve issues proactively • Delivers Continuous Feedback:Actual, real-time process information imported back into original process model • Notification System:Enables users to receive instant alerts based on process time, cost and process information • User-Defined Measures:View the process information you want to see • Security:Provides web-based, granular access control of users and groups
WBI Monitor Overview • Data Sources: • Data and audit trail of WebSphere MQ Workflow • Data and events from WebSphere Business Integration Message Broker V5 and WebSphere MQ Integrator Broker V2.1 • Non-process business data from some external databases (DB2 & Oracle) • Real-time and historical information from WebSphere BI Server Collaborations (ICS) WebSphere MQWF Collaborations WBI Monitor Databases Message Flows
Executive level view Operational view View alerts based on process performance Define new or alter business measures for viewing
Provides a high-level, strategic view of the automated process Provides tactical problem solving on-the-fly for senior management Displays Business Measures defined in WBI Workbench Easily add/remove Business Measures without any IT coding WBI Monitor – Business Dashboard
Non-numeric fields are available for breakdown analysis WBI Monitor – Breakdown Attributes
Provides an operation console of automated business process Enables users to perform administrative and corrective actions (suspending, reassigning, etc.) on in-flight work items Enhanced alert system creates WBI Monitor Notifications, e-mails and/or corrective process instance instantiations WBI Monitor – Workflow Dashboard
WBI Monitor – Actual Values WBI Modeler Analyze & compare actuals from model imported from the Monitor Select processes & timeframe
Manage • Available Portlets • 1. Business Dashboard • 2. Workflow Dashboard • 3. Process Diagram portlet • 4. Notification Business Activity Workplaces • Compose monitor and manage elements into overall workplace • Portlets provided for process status, alert notification, statistical analysis • Exploit partnerships with reporting vendors for historical analysis portlets • Provide starting point template with reusable visual elements – charting, productivity components, visualization Process-based monitoring example of a business activity workplace.
Agenda • Product Overview • Creating Business Measures • Integration Highlights • Product Directions
Applies to WebSphere MQ Workflow only Users are provided 14 pre-defined metrics Users can define any custom metrics desired, based on the data elements in the workflow process Select the data field and provide the desired name As long as the data item is captured in process (entered by person or obtained from system) it can be monitored and alarms can be triggered Step 1: Define Data to be Evaluated
Simple Business Measures display any data from the process in real-time Expressions cause metrics to be evaluated prior to displaying information In this case, Total_Cost data field is being compared to Total_Budget Step 2: Create Expressions (If Desired)
User selects what step in the process the Metric (or data) will be captured Process steps are provided in the ‘Name’ drop-down box PROCESS_START and PROCESS_END are pre-defined locations Step 3: Define Location to Capture Information
Step 4: Define Notifications • User indicates what type of notification is desired • e-mail • and/or monitor alarm • workflow process instance • Criteria is defined to determine who receives the notification
Create the template that will provide necessary e-mail and/or monitor information in the message It is possible to include specific data fields information in the message body XML file is created by WBI Workbench modeling tool. This file is imported into WBI Monitor to ‘program’ what information to capture NO coding is required Step 5: Define Notification Message
Agenda • Value Proposition • Product Overview • Creating Business Measures • Integration Highlights • Product Directions
WBI Workbench / Monitor – Integration Highlights - I • WBI Workbench - Monitor integration • WBI Workbench exports business measures to WBI Monitor prior to production • WBI Monitor exports real performance data back into WBI Workbench • WMQ Workflow • WBI Workbench converts process models into FDL (Flow Definition Language) so it can be exported directly to WebSphere MQ Workflow • Provides workflow validation for your process models for compatibility with WebSphere MQ Workflow • WBIMB • WBI Workbench creates artifacts (XSD) used to create broker message set • Monitors broker message flows using the Emitter Node (broker SupportPac)
WBI Workbench / Monitor – Integration Highlights - II • WICS • WBI Workbench represents a WICS collaboration with a special node type in the process model • WBI Workbench, when used with System Manager, can drill into a Collaboration Node and open the WICS Process (collaboration) Designer • Monitor WICS collaborations (under WMQWF control, or standalone) • Rational Tools • WBI Workbench can import/export data to Rose, export to XDE • Other sources • Database metrics from bases can now be monitored as business measures included with existing processes
WBI Monitor – WBI Message Broker Integration Steps Represent MB Message Flows using the WMQI Task Node in the process model Export XSD from WBI Workbench used to create broker message set Import XSD from WBI Workbench into WBI Message Broker ESQL is modified so that business measure information is placed in the messages Modify message flows adding: Emitter Node (SupportPac IB01) to the flows to be monitored (provides connection to Monitor database) Pairs of Compute nodes to flows to be monitored (ESQL in compute nodes is modified to create business measure information) Import XML file from broker message flows using the new Emitter Node (broker supportpac)
Modeler Export In/out Data Structure Emitter Node Import XSD Monitor Database EN Other Nodes MRM WBI Monitor Compute Nodes WBI Workbench – Monitor Broker Integration • Events are outside the scope of any message flow transaction, so they are written whether the message flow executes successfully or not • No effect on msg processing, absorbs any exceptions • The event record contains any business process data you choose, the structure of which is defined in modeler, and some predefined information WMQI TASK Events Broker Tooling Emitter Node – Broker Supportpac IB01
WBI Monitor – WICS Integration • WBI Workbench represents a WICS collaboration with a special node type in the process model, this representation is carried through to WBI Monitor • Monitor WICS collaborations (under WMQWF control, or standalone) • Modeler is used to represent the process model in either case • For monitoring Collaborations outside WMQWF control, a new utility is provided (Auditing Utility determines which collaborations send events to WBI Monitor) • User defined business measures are not displayed for collaboration tasks or groups
WBI Monitor – WICS Integration • In the Workflow Dashboard: • Admin Actions, Cost and Description columns in Process Instance table are NOT displayed, as they do not apply to Collaborations, nor can they be selected in the Business Measures page • Transfer, Assigned Employees and Cost columns in the Activity Instances table are not displayed, and cannot be selected in the Select columns page • In the Business Dashboard: • Average cost pre-defined business measure does not appear • The Organization Unit/User selection option is disabled • The main organization will be selected by default, and no sub organizations can be selected
Monitor DB WBI Monitor – WICS Integration Steps • Define System Manager processes and collaborations using WBI Workbench and export • Install WBI Monitor with WICS as one of the selected flow engines • Reconfigure the Flow Monitoring Service in WICS to emit events to the WBI Monitor Database • Load the process model (XML version) into the Audit Utility • Use the Audit Utility to define which Collaborations are enabled for monitoring • Specify the imported processes to monitor in WBI Monitor
WBI Monitor – Database Integration • Consider the an existing process where the values from a database query could be monitored and provide additional benefit to a workflow or business dashboard • This database query will be seen in monitor as another business measure (actually a database metric surfaced as a business measure ) • Like other business measures, locations and conditions can be specified in conjunction with the database metric
WBI Monitor – Database Integration Steps • Determine the process in which the database query will be used (database metrics only have meaning to WBI Monitor as they exist in the context of an existing process) • Define a new database metric, from the Monitor Admin – Database Metrics Configuration panel • Name • DataSource (a database defined to WAS, accessible via JNDI name) • Query (static or variable type query) • Define a new Business Measure that uses this database metric • Select & view this Business Measure as any other in the WBI Monitor
WebSphere BI Monitor – Summary Points • Powerful tool for determining & tracking process performance • Respond to variations in process performance by redirecting, adjusting, and stopping process flows dynamically • Delivers continuous feedback based on real-time data • Define, display alerts based on process data and take immediate corrective action • Allows process based decision-making • User-defined measures and views • Supports continuous improvement by moving real performance data into Modeler for iterative process analysis and simulation
Agenda • Value Proposition • Product Overview • Creating Business Measures • Integration Highlights • Product Directions ( IBM CONFIDENTIAL )
Monitor Monitor Model Model WBI Monitor 5.1 Conceptual Understanding Metadata Flow Business Observation Transformation IT Observation Aggregation Supporting Infrastructure CEI, Correlation Engine, Event Store IBM CONFIDENTIAL
BPM: Business Level Modeling WBI Modeler Policy Model Operations Model Observation Model Define Business Metrics & KPIs Define Business Operations Info Model: Define Business Events & Other Artifacts Indicate Events of Interest & Model Context Indicate Where & What Events to Emit Organization Model IBM CONFIDENTIAL
Manage Model conceptual flows conceptual (may include documents event emitters) state of monitored metric configure entities model monitor Correlation Engine Correlation Engine thresholds / limits statistics / history listen to events notify of carrying data for business deploy event emitter business metrics situations configurations discovered Hardware Hardware Enterprise WebSphere Legacy Applications Applications Systems WBI WBI Operating Operating (e.g. SAP) Infrastructure Infrastructure Systems Systems Applications Applications event emitter event emitter event emitter event emitter event emitter event emitter emitter emitter emitter event event event Shared Event Bus Shared Event Bus Event Bus IBM CONFIDENTIAL
Reference: WBI Monitor v.5.1 Architecture (SDD0) Monitoring Contexts (Observation Model Instances) Customer Specific IBM Component Monitor Component Business Activity Workplace Dashboards Admin Console Business Activity Analysis & Reporting Dashboard Services Business Activity Warehouse WBI Monitor Data Store ETL Action Manager Observation Manager Adaptive Action Intelligent Notification Context Situation Selected Events Event Selector Situation Detector (Condition) Situation Generator (Conclusion) CBE Event(s) CBE Event(s) Event Correspondence Engine Event Sources MQWF WBI-MB WBI ICS WBISF Adapters Connect .. IBM CONFIDENTIAL
For More Information WBI Monitor • http://www-3.ibm.com/software/integration/wbimonitor/ • http://swpi.boulder.ibm.com/smi.nsf/docs-us/ibmwebspherebusinessintegrationmonitorversion4.2.4overview • WebSphere Business Integration Monitor - Support - IBM Software WBI Modeler • http://www-3.ibm.com/software/integration/wbimodeler • http://swpi.boulder.ibm.com/smi.nsf/docs-us/ibmwebspherebusinessintegrationmodelerversion4.2.4overview • WebSphere Business Integration Modeler - Support - IBM Software