Download
1 / 17
170 likes | 233 Views
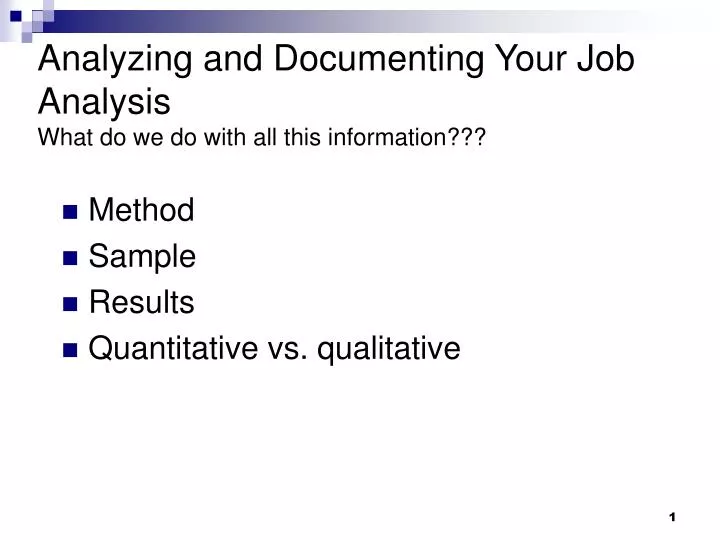
Analyzing and Documenting Your Job Analysis What do we do with all this information???. Method Sample Results Quantitative vs. qualitative. Available Guidance. Uniform Guidelines on Employee Selection Procedures ( www.uniformguidelines.com )

E N D
Analyzing and Documenting Your Job AnalysisWhat do we do with all this information??? • Method • Sample • Results • Quantitative vs. qualitative
Available Guidance • Uniform Guidelines on Employee Selection Procedures (www.uniformguidelines.com) • Principles for the Validation and Use of Personnel Selection Procedures (published by the Society for Industrial and Organizational Psychology)
Method • How did you collect the data? • Interviews • Observation • Questionnaire • Other • What was your procedure? Was it consistent across events? • Include any documents used as part of the process • Interview/observation protocols • Task questionnaires
Sample • Who provided the job information? • Who did you talk to, observe, interview? • Are these people representative of your population as a whole? • Provide demographic information as relevant, while still protecting identity of respondents.
2005 Study:Questionnaire Response • 79% (226) of the FBN workforce responded to the questionnaire !!! • Responses were evenly distributed across the bureaus, grades and tenure groups. • Distribution of responses, tracking to particular job categories, made sense compared with current bureau staffing information.
Results • What are the important tasks and/or KSAOs for your purpose? • How do you know that? • Provide information that will allow the audience to determine if they agree with your assessment. • With quantitative data, present at least means and standard deviations. • Thoughts on determining and presenting results with qualitative data?
Example Descriptive Stats Note: Criticality scores (2*I + F) should range from 3-15.
Level of Agreement • Important part of presenting results. • If you have low agreement, need to determine the source • Error? • Real variance? • Are there individual characteristics related to the variance (for example, experience) • Quantitative vs. qualitative approaches
Job Descriptions • First product that is often developed from job analysis data • Should be fairly short and contain • Job title • Job summary • Duties and tasks • Qualifications • Work conditions • Stability of job descriptions