Download
1 / 70
720 likes | 949 Views
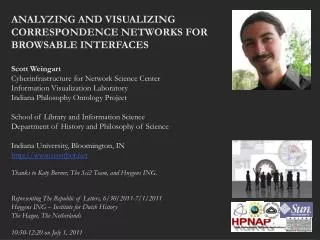
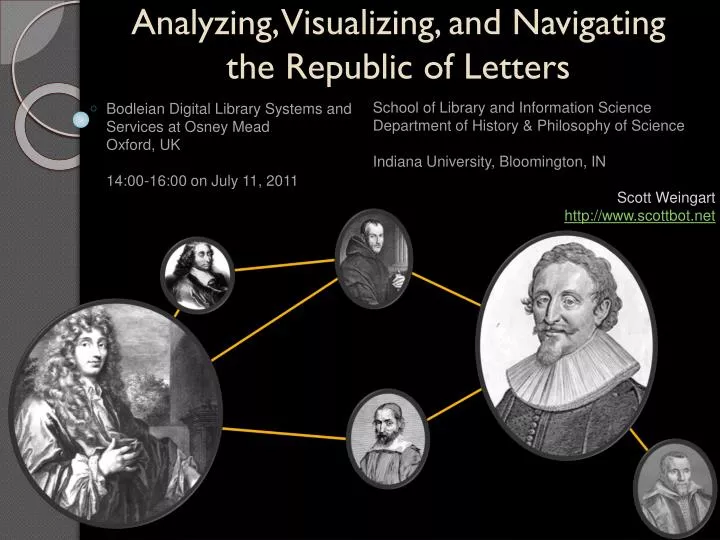
Analyzing, Visualizing, and Navigating the Republic of Letters. Bodleian Digital Library Systems and Services at Osney Mead Oxford, UK 14:00-16:00 on July 11, 2011. School of Library and Information Science Department of History & Philosophy of Science Indiana University, Bloomington, IN

E N D
Analyzing, Visualizing, and Navigating the Republic of Letters Bodleian Digital Library Systems and Services at Osney Mead Oxford, UK 14:00-16:00 on July 11, 2011 School of Library and Information Science Department of History & Philosophy of Science Indiana University, Bloomington, IN Scott Weingart http://www.scottbot.net
Schedule • 14:05 - 14:15: Why Visualize? • 14:15 - 14:30: Visualizations of the Republic of Letters • 14:30 - 14:45: Future Possibilities • 14:45 - 14:55: Questions • 15 Minute Break • 15:10 - 15:15: Data Conceptualizations • 15:15 - 15:25: Data Formats • 15:25 - 15: 40: Visualization Packages • 15:40 - 15:45: To-Do • 15:45 - 16:00: Questions
Schedule • 14:05 - 14:15: Why Visualize? • 14:15 - 14:30: Visualizations of the Republic of Letters • 14:30 - 14:45: Future Possibilities • 14:45 - 14:55: Questions • 15 Minute Break • 15:10 - 15:15: Data Conceptualizations • 15:15 - 15:25: Data Formats • 15:25 - 15: 40: Visualization Packages • 15:40 - 15:45: To-Do • 15:45 - 16:00: Questions
Why Visualize? Inspiration
Napoleon’s March -Minard Army Location, Direction, Split, Size | Temperature | Time http://upload.wikimedia.org/wikipedia/commons/2/29/Minard.png
Why Visualize? The Many Uses
The Importance of Visualization [Visualizations] aim at more than making the invisible visible. [They aspire] to all-at-once-ness, the condensation of laborious, step-by-step procedures in to an immediate coup d’oeil… What was a painstaking process of calculation and correlation—for example, in the construction of a table of variables—becomes a flash of intuition. And all-at-once intuition is traditionally the way that angels know, in contrast to the plodding demonstrations of humans. Descartes’s craving for angelic all-at-once-ness emerged forcefully in his mathematics…, compressing the steps of mathematical proof into a single bright flare of insight: “I see the whole thing at once, by intuition.” Lorraine Daston – On Scientific Observation
The Many Uses of Visualizations • Solidification of objects of inquiry • Summarizing data • Exploration/Navigation • Discovery • Trend-spotting • Evidence • Audience Engagement • Engaging public / funding agencies
Schedule • 14:05 - 14:15: Why Visualize? • 14:15 - 14:30: Visualizations of the Republic of Letters • 14:30 - 14:45: Future Possibilities • 14:45 - 14:55: Questions • 15 Minute Break • 15:10 - 15:15: Data Conceptualizations • 15:15 - 15:25: Data Formats • 15:25 - 15: 40: Visualization Packages • 15:40 - 15:45: To-Do • 15:45 - 16:00: Questions
Visualizations of the Republic of Letters Previous Work
Peiresc Correspondence -Mandrou Correspondents Per City | Geographic Spread
Peiresc Correspondence -Hatch Letters per Year | Letters per City | Geographic Spread http://www.clas.ufl.edu/users/ufhatch/pages/11-ResearchProjects/peiresc/06rp-p-corr.htm
Republic of Letters -Hatch Letters per Year | Correspondent Comparisons
Grotius Correspondence -Weingart Sender & Recipient Locations | Geographic Spread
Republic of Letters -Stanford S&R Locations | Comparisons | Time | Correspondents https://republicofletters.stanford.edu/
Republic of Letters -Stanford S&R Locations | Location Volume | Time | Uncertainty https://republicofletters.stanford.edu/
Republic of Letters -Weingart Communities | Time | Central Correspondents | Volume & Flow
Grotius Correspondence -Weingart Letters over Time | Correspondent Share | Location Share
Epistolarium -CKCC Full Text | Senders & Recipients | Keywords | Time | Language
Epistolarium -CKCC Time | Correspondent | Volume
Epistolarium -CKCC Geographic Spread | Volume
Epistolarium -CKCC Communities | Correspondent Centrality | Volume
Epistolarium -CKCC Topics
Schedule • 14:05 - 14:15: Why Visualize? • 14:15 - 14:30: Visualizations of the Republic of Letters • 14:30 - 14:45: Future Possibilities • 14:45 - 14:55: Questions • 15 Minute Break • 15:10 - 15:15: Data Conceptualizations • 15:15 - 15:25: Data Formats • 15:25 - 15: 40: Visualization Packages • 15:40 - 15:45: To-Do • 15:45 - 16:00: Questions
Future Possibilities Breaking Free of Graphs
Clustering McKechnie et al. http://informationr.net/ir/10-2/paper220.html • Hierarchical • Groups • Still Spaghetti
Circular Hierarchies Holton - http://www.win.tue.nl/~dholten/papers/bundles_infovis.pdf • Re-interpreting the Network • Hierarchies • Clusters • Edge Bundling • Increased Dimensionality
Increasing Dimensionality http://www.medialab.sciences-po.fr/index.php?mact=CGCalendar,cntnt01,default,0&cntnt01event_id=23&cntnt01display=event&cntnt01returnid=15 • Graphs in 3.5 dimensions • (Time? Space?)
Maps – Adding Advanced Networks Meeks http://dh2011network.stanford.edu/acercaDe.html
Bringing in the Old David Rumsey – Google Earth http://www.davidrumsey.com/ • Visualizing the world as they saw it
Bringing in the Old David Rumsey – Google Earth http://www.davidrumsey.com/
Small Multiples Andrew Gelman - http://www.juiceanalytics.com/writing/better-know-visualization-small-multiples/
Visualizing Narrative - XKCD Randall Munroe – http://www.xkcd.com
Dimensionality Reduction – Last.FM Biberstine – Indiana University
Travel Time on Commuter Rails New York Times - http://nyti.ms/irMnHS
Travel Time vs. Carbon Footprint In Paris http://xiaoji-chen.com/blog/2010/map-of-paris-visualizing-urban-transportation/
New York Subway Ridership http://diametunim.com/blog/?p=111
Analyzing, Visualizing, and Navigating the Republic of Letters – Scott Weingart Thank You
Schedule • 14:05 - 14:15: Why Visualize? • 14:15 - 14:30: Visualizations of the Republic of Letters • 14:30 - 14:45: Future Possibilities • 14:45 - 14:55: Questions • 15 Minute Break • 15:10 - 15:15: Data Conceptualizations • 15:15 - 15:25: Data Formats • 15:25 - 15: 40: Visualization Packages • 15:40 - 15:45: To-Do • 15:45 - 16:00: Questions
Schedule • 14:05 - 14:15: Why Visualize? • 14:15 - 14:30: Visualizations of the Republic of Letters • 14:30 - 14:45: Future Possibilities • 14:45 - 14:55: Questions • 15 Minute Break • 15:10 - 15:15: Data Conceptualizations • 15:15 - 15:25: Data Formats • 15:25 - 15: 40: Visualization Packages • 15:40 - 15:45: To-Do • 15:45 - 16:00: Questions
Schedule • 14:05 - 14:15: Why Visualize? • 14:15 - 14:30: Visualizations of the Republic of Letters • 14:30 - 14:45: Future Possibilities • 14:45 - 14:55: Questions • 15 Minute Break • 15:10 - 15:15: Data Conceptualizations • 15:15 - 15:25: Data Formats • 15:25 - 15: 40: Visualization Packages • 15:40 - 15:45: To-Do • 15:45 - 16:00: Questions
Data Conceptualizations Planning Early
Representing Uncertainty • Three kinds of uncertainty: • Uncertain fields within an entry • Missing entries • Unknown entries • Degrees of certainty • Ranges of certainty (time, space, quantity)
Representing Continuity • Digital vs. Analog, Discontinuous vs. Continuous, Points vs. Fields • Time (point vs. range) • Space • Granularity – town, city, county, country • Range – town, city, county, country • Authorship – how is it distributed? • What is a document? Can they be nested? Sent along? Continued?
Schedule • 14:05 - 14:15: Why Visualize? • 14:15 - 14:30: Visualizations of the Republic of Letters • 14:30 - 14:45: Future Possibilities • 14:45 - 14:55: Questions • 15 Minute Break • 15:10 - 15:15: Data Conceptualizations • 15:15 - 15:25: Data Formats • 15:25 - 15: 40: Visualization Packages • 15:40 - 15:45: To-Do • 15:45 - 16:00: Questions
Data Formats Networks
Network Formats • Matrix • Adjacency List • Node & Edge List
NWB Format *Nodes id*int label*string totaldegree*int 16 “Merwede van Clootwyck, Matthys van der (1613-1664)” 1 36 “Perrault, Charles” 1 48 “Bonius, Johannes” 1 67 “SurenhusiusGzn., Gulielmus” 1 99 “Anguissola, Giacomo” 1 126 “Johann Moritz, von Nassau-Siegen (1604-1679)” 6 131 “Steenberge, J.B.” 1 133 “Vosberghen Jr., Caspar van” 1 151 “Bogerman, Johannes (1576-1637)” 25 *DirectedEdges source*int target*int weight*float eyear*intsyear*int 16 36 1 1640 1650 16 126 5 1641 1649 36 48 2 1630 1633 48 16 4 1637 1644 48 67 10 1645 1648 48 36 2 1632 1638 67 133 7 1644 1648 67 131 3 1642 1643 99 67 9 1640 1645 126 16 3 1641 1646 131 133 5 1630 1638 131 99 1 1637 1639 133 36 4 1645 1648 133 48 8 1632 1636 151 48 6 1644 1647
GraphML Format <?xml version="1.0" encoding="UTF-8"?> <!-- This file was written by the JAVA GraphML Library.--> <graphmlxmlns="http://graphml.graphdrawing.org/xmlns" xmlns:xsi="http://www.w3.org/2001/XMLSchema-instance" xsi:schemaLocation="http://graphml.graphdrawing.org/xmlns http://graphml.graphdrawing.org/xmlns/1.0/graphml.xsd"> <graph id="G" edgedefault="directed"> <node id="n0"/> <node id="n1"/> <node id="n2"/> <node id="n3"/> <node id="n4"/> <edge source="n0" target="n2"/> <edge source="n1" target="n2"/> <edge source="n2" target="n3"/> <edge source="n3" target="n5"/> <edge source="n3" target="n4"/> </graph> </graphml>