Download
1 / 25
250 likes | 407 Views
Modelling Labour Supply : Issues and Challenges. Labour Supply Monitoring and Forecasting Workshop Vancouver, British Columbia October 17-18, 2007. Context. Occupational supply modelling is currently done only at the national level

E N D
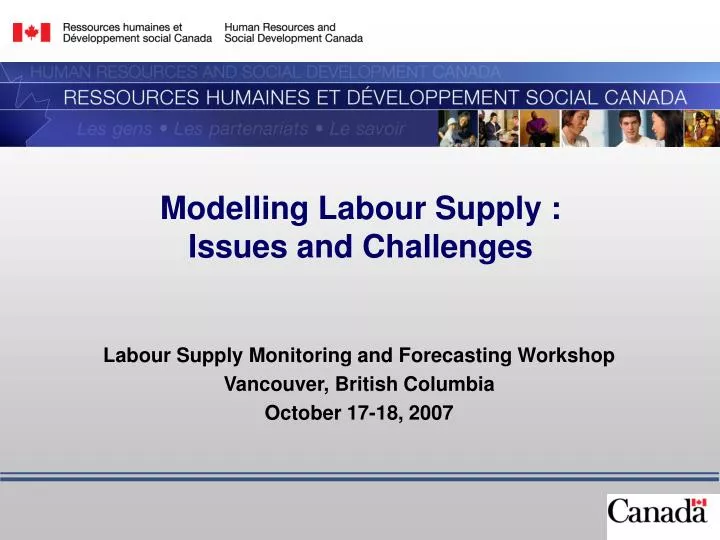
Modelling Labour Supply : Issues and Challenges Labour Supply Monitoring and Forecasting Workshop Vancouver, British Columbia October 17-18, 2007
Context • Occupational supply modelling is currently done only at the national level • All demand side components (expansion and replacement demands) are currently produced at both the national and provincial levels • Interest has been expressed in creating provincial supply models
Purpose of this presentation • Describe the current labour supply modelling of COPS • Highlight the current issues and challenges (data, models) surrounding the production of national level labour supply projections • Highlight the additional challenges in undertaking labour supply projections at the provincial level
Current modelling structure of COPS
Uses and dissemination • The ability to do forward-looking analysis is considered essential in improving HRSDC’s capacity to deliver effective policy decision making. • Results from the projections are presented in “Looking-Ahead: a 10-year Outlook for the Canadian Labour Market”. • Results from the projections are also used in the development of planning and decision-making tools. • HRSDC provides data and projections to Service Canada for the production of Job Futures. • Labour demand projections are also provided to the provincial governments and Service Canada’s regional offices, which use them to develop their own specific LMI products.
COPS modelling structure Aggregate Macroeconomic and Labour Market Indicators Demographics Employment by Industry Labour Force Expansion Demand Retirements School Leavers Immigrants Future Labour Market Imbalances by Broad Skill Level • Change in employment versus • change in labour force by broad skill level Future Labour Market Imbalances by Occupation • Job openings versus new job • seekers by occupation
FOS2 FOS3 FOSi FOS1 Out LF In LF NOC2 NOC3 NOC1 NOCn School Leavers Model Drop Outs* Graduates 1. Graduates by educational level 2. Graduates by major field of study 3. Allocate in or out of the labour force 4. School leavers allocated by occupation 7
1. Graduates by educational level -Graduates are projected by level of education -6 different levels of education are estimated, 2 are obtained residually: • Secondary • Trade and vocational • College • Bachelor • Master • PhD Drop outs Less than high school Some post-secondary The level of enrolments is projected based on source population, as well as economic factors. Graduates are then estimated using enrolments.
Graduates FOS2 FOS3 FOSi FOS1 2. Graduates by major field of study Graduates are distributed by FOS according to the observed average distribution of the last 3 years (PSIS/USIS/CCSIS). • Fixed proportion over the projection period. No field of study for the following: • Less than high school • Secondary school graduates • Some post-secondary At the post-secondary level: • 49 FOS for Trade and vocational • 55 FOS for College • 58 FOS for the three university levels (Bachelor, Master and Doctorate).
FOSi Out LF In LF 3. Allocate in or out of the labour force • By field of study, the share of graduates in the labour market is determined using: • The Labour Force Survey for: • Less than high school (15-24 years old); • High school grads (15-24 years old); • Some post-secondary (20-29 years old). • The National Graduate Survey for: • Trade and vocational; • College; • University (Bachelor, Master and Doctorate).
In LF NOC2 NOC3 NOC1 NOCn 4. Allocate by occupation Data sources: A) For the 3 non post-secondary levels: Labour Force Survey (LFS) B) For the 5 post-secondary levels: National Graduates Survey • In 2002, graduates from 2000 • In 1997, graduates from 1995 Other sources considered: • Job Futures; • Occupation descriptions from the NOC; • Matrix of Skills Transferability by Margaret Roberts (2003). Ex-ante distribution: allocation not allowed if unrelated to FOS or skill level too low
It is assumed that each school leaver will offer his/her service to jobs related to his/her education level and field of study 4. Allocate by occupation • E.g.: Bachelor graduates in nursing are constrained to occupy a job such as: • Nurse Supervisors and Registered Nurses (NOC 315); • Other Technical Occupations in Health Care (NOC-323); • Assisting Occupations in Support of Health Services (NOC-341); • Manager in Health (NOC-031); • Medical Technologists and Technicians (NOC-321). • and not occupy jobs like: • Managers in Retail Trade; • Cashier.
Immigrants Out LF In LF NOC2 NOC3 NOC1 NOCn Immigration model 1. Projection of the number of immigrants 2. Allocate in or out of the labour force 3. Allocate by occupation* *Allocation based on information for recent immigrants (from the latest census) 13
Current issues and challenges surrounding the production of labour supply projections
Data challenges Issues • Timeliness • Sample size/Reliability Major data sources used in supply • Administrative data (enrolments, graduations) • National Graduates Survey • Labour Force Survey
Data issues - Timeliness A) Administrative data (enrolments, graduations) • Significant lags in data used to forecast enrolments and graduations : • Data for high school is made available through the ESESP: latest data 2004/2005 • Data for trade and vocational programs is acquired from TVOC survey: latest data 1999/2000 • Data for community colleges comes from the CCSIS: latest data 1999/2000 • University level data comes from the PSIS survey and is spliced with the (discontinued) USIS survey: latest data 2003/2004 • We thus need to forecast the past before forecasting the future! → Challenge: To speed up the release of data
Data issues - Timeliness B) National Graduates Survey • Produced occasionally (5-year cycles): • Graduates of 1995 in 1997, follow-up in 2000 • Graduates of 2000 in 2002, follow-up in 2005 • Graduates of 2005 in 2007 (in process), follow-up in 2010 (planned) • Results depend on when the survey is conducted (economic cycles) : • E.g.: using 2000 NGS information to distribute computer graduates among occupations might be misleading given collapse in IT jobs in 2002. • Change in occupational coding every 10 years makes it difficult to use historical data (using many NGSs) .
Data issues - Reliability A) Administrative data (enrolments, graduations) • The fields of study used in COPS are outdated: • e.g. 6 secretary programs at the TVOC level. B) National Graduates Survey The NGS 2002 (class of 2000) has 38,483 respondents. When building the distribution matrix of (5 post-secondary education levels) X (49 to 58 fields of study) X (140 occupations) → very small sample. • We use several NGSs to overcome small cell problems • Some fields of study are easier to allocate (e.g. nursing) than others (e.g. English literature). → Challenge: Rework FOS according to CIP
Data issues - Reliability C) Labour Force Survey The sample size of the LFS is about 54,000 households (accounts for approx. 83,000 respondents). To build the school leaver distribution matrix for the 3 non post-secondary education levels (140 occupations), LFS data for youth is used. • Analysis of the coefficients of variation undertaken in 2003 shows that 3-digit occupations data broken down by 33 industries is reliable at the national level. • We use the average distribution of the latest three years.
Supply modelling challenges School leavers model • Introduce dynamic in the distribution of graduates by field of study over time. • Redefine COPS fields of study (using CIP) • Re-examine the current model structure based on research currently undertaken • Introduce supply adjustment using substitution between broad occupational groups and skill level (ROA 2004) Immigration model • Re-examine the current model structure based on research currently undertaken (Cristiana Pescarus)
Other supply modelling challenges • Assessment of current labour market imbalances by occupation • Modelling of vertical occupational mobility (e.g. supply for managers) • Segmenting the labour market • Assessing work intensity (e.g. hours worked, full- versus part-time work)
Provincial supply challenges • Data timeliness: • The use of data collected by provincial Departments of Education can mitigate this problem. • Data reliability: • As we disaggregate further (in this case by province), the reliability of data declines: see next slide • Options: • Aggregate data (bundle FOS, educational levels or occupations) • Find alternate data source with larger sample size (Census, province-specific NGS) • Seek to increase sample size through investment in data • Model: • Need to model inter-provincial migration
Data reliability • Data reliability is an issue at the provincial level. • It is difficult to produce projections when data have large standard deviations.
Next Steps • At the national level • Continue to work on developing the supply model • Introduce dynamic in the projection of FOS • Redefine COPS FOS • Re-examine the current model structure based on research currently underway • At the provincial level • Provide technical expertise to provinces in building supply models • At the 2006 COPS Conference, supply models were presented and B.C. showed interest in modelling supply • Caveat: Provinces interested in building a supply model should first focus their attention on data (availability and reliability).