Download
1 / 29
290 likes | 419 Views
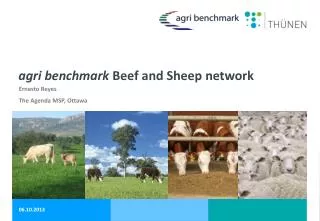
Agri Benchmark Beef conference 2007. By Pieter Taljaard and André Jooste. Outline. Introduction and background Co-workers and countries Agri-benchmark Methodology RSA representative data Results Conclusions. Introduction & Background. International farm comparison analysis

E N D
Agri Benchmark Beef conference 2007 By Pieter Taljaard and André Jooste
Outline • Introduction and background • Co-workers and countries • Agri-benchmark Methodology • RSA representative data • Results • Conclusions
Introduction & Background • International farm comparison analysis • Beef finishing (feedlots) • Cow-calf production system • Collaboration in RSA UP - NAMC –UFS • NAMC (Membership sponsor) • UFS (Beef) • UP (Cash crops) • Dairy (MPO) • Overall objectives – competitiveness and potentials of regions
Introduction & Background • 2007 Beef conference and pre-conference training • Braunschweig, Germany • New countries: RSA, Australia and India • Beef finishing - 16 countries, 38 farms
Participating countries • Western Europe • Austria • France • Germany • Italy • Ireland • Spain • Sweden • UK • Eastern Europe • Hungary • Poland • North America • Canada • USA
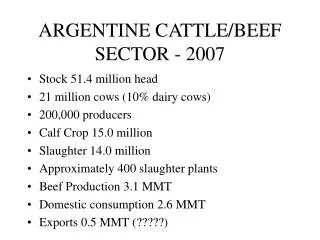
Participating countries • Asia & Oceania • Australia • China • India • South America • Argentina • Brazil • Africa • South Africa
Agri-Benchmark (AB) methodology • AB SOP • Select regions and locations • ID prevailing production system • Determine farm size of typical farm(s) • Data collection (2007) and updating (2008) • Standard questionnaire (pannel of farmers) • Farm data - Typical or representative figures • Prices for inputs and outputs
RSA representative data • 1 Beef finishing (feedlot) • One time standing capacity 25 000 head (i.e. +/- 75 000 head annual through-put) • 3 Cow-calve farms • Vryburg (250 cows) • Heibron (300 cows) • Howick (200 cows)
Results - Beef finishingMarket returns and coupled government payments 2006 (US$ per 100 kg carcass weight)
Results - Beef finishingPurchase prices (US$ per 100 kg live weight)
Results - Beef finishingTotal cost by cost items (US$ per 100 kg carcass weight)
Results - Beef finishingNon-factor costs by animal purchases and other cost (US$ per 100 kg carcass weight)
Results - Beef finishingNon-factor costs excluding animal purchases (US$ per 100 kg carcass weight)
Results - Beef finishingShort and medium term profitability (US$ per 100 kg carcass weight)
Results - Cow-calf farms Weight at weaning per head (kg live weight per head)
Results - Cow-calf farms Weaner prices per head (US$ per head) R2800/ head
Results - Cow-calf farms Weaner prices per 100kg live weight (US$ per 100kg live weight)
Results - Cow-calf farms Total returns (US$ per 100 kg live weight sold)
Results - Cow-calf farms Total cost by factor and non-factors costs (US$ per 100 kg live weight sold)
Results - Cow-calf farms Labour intensity (hours per suckler-cow and year)
Results - Cow-calf farms Total returns and costs by cash and non-cash costs (US$ per 100 kg live weight sold)
Results - Cow-calf farms Short and medium term profitability (US$ per 100 kg live weight sold)
Results - Cow-calf farms Whole farm profitability (‘000 US$ per farm)
2008 • Annual update – expand • Local network (regional) • Emissions benchmarking • Quarterly price info • Trade profiles • Beef conference (Brazil) • Bio-energy and beef production • SA farm story (case farm)
Conclusion • Larger representation in SA • Useful info • Further analysis • Comparative advantage analysis • Involvement of industry