Download
1 / 5
50 likes | 165 Views
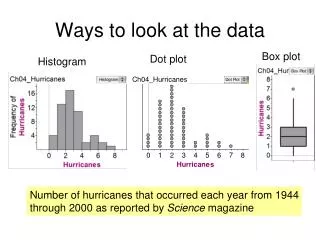
3 Ways to Look at Data. Class Average CST Score (HS) Year to Year CST Performance Bands (MS) Student Movement between CST Performance Bands (HS). Data is from LD 4 Algebra 1 Classes Data collected by 3 of our schools. Hollywood High School 2006-2007 Algebra 1AB Average CST Scores.

E N D
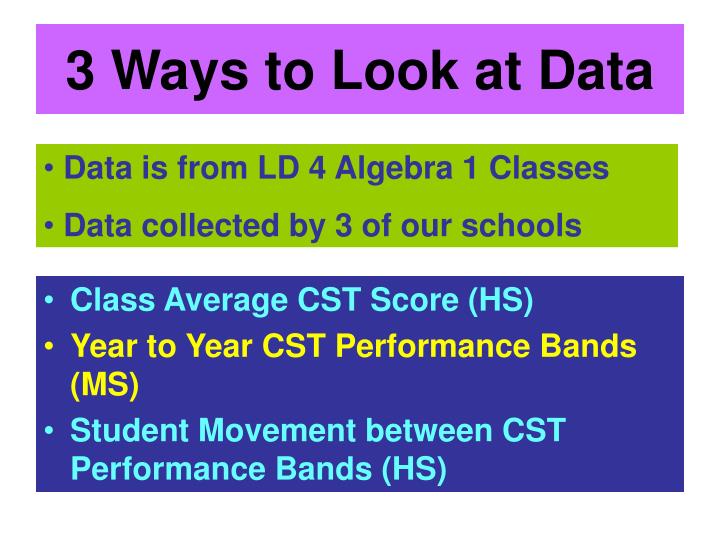
3 Ways to Look at Data • Class Average CST Score (HS) • Year to Year CST Performance Bands (MS) • Student Movement between CST Performance Bands (HS) • Data is from LD 4 Algebra 1 Classes • Data collected by 3 of our schools
Hollywood High School2006-2007 Algebra 1AB Average CST Scores
Fairfax High SchoolAlgebra 1AB Movement in Performance Bands A = Advance ☻P = Proficient ☻ B = Basic ☻ BB = Below Basic ☻ FBB = Far Below Basic Each student given score based on movement between performance bands. • +1 given if FBB to BB, BB to B, B to P, or P to A. • – 1 given if A to P, P to B, B to BB, or BB to FBB. • +2 given if FBB to B, BB to P, or B to A • -2 given if A to B, P to BB, or B to FBB Then each class given a net score.
Fairfax High SchoolAlgebra 1AB Movement in Performance Bands