Download
1 / 16
160 likes | 173 Views
Events Leading up to the Crisis. Crisis. Crisis. Crisis. Crisis. Crisis. Crisis. Crisis. Crisis. Crisis. Crisis. Crisis. Crisis. Crisis. Crisis. Crisis. Crisis. Crisis. Crisis. Crisis. $15,230. $12,078. Oil Crisis & Recovery. OPEC raises oil prices and restricts certain shipments

E N D
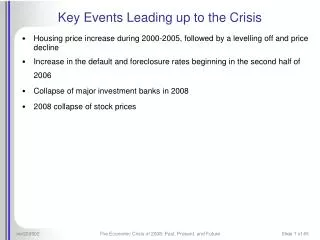
Events Leading up to the Crisis Crisis. Crisis. Crisis. Crisis. Crisis. Crisis. Crisis. Crisis. Crisis. Crisis. Crisis. Crisis. Crisis. Crisis. Crisis. Crisis. Crisis. Crisis. Crisis.
$15,230 $12,078 Oil Crisis & Recovery • OPEC raises oil prices and restricts certain shipments • As a result, oil prices quadruple by 1974 $8,060 12/31/71 12/31/76 A History of Financial Crises—and Recoveries 12/31/67 12/31/69 12/31/79 12/31/89 12/31/99 12/31/08 Data Source: Ned Davis Research, 1/09. The S&P 500 Index is a composite of the 500 largest companies in the United States. INDEX PAST PERFORMANCE IS NOT INDICATIVE OF FUTURE RESULTS. This illustration is for illustrative purposes only, and does not represent the performance of The Hartford Mutual Funds, The Hartford variable annuities, or any particular investment. The S&P 500 Index is unmanaged. You cannot invest directly in the S&P 500 Index. Assumes reinvestment of income and no transaction cost. Market low for each crisis Crisis. Crisis. Crisis. Crisis. Crisis. Crisis. Crisis. Crisis. Crisis. Crisis. Crisis. Crisis. Crisis. Crisis. Crisis. Crisis. Crisis. Crisis. Crisis.
$32,208 $20,764 Severe Recession & Recovery • Worst recession since Depression; unemployment at 10.8% • Inflation: 13.5% in 1980 • 6-month CD rates: more than 13% $19,453 3/31/84 8/31/80 A History of Financial Crises—and Recoveries 12/31/67 12/31/69 12/31/79 12/31/89 12/31/99 12/31/08 Data Source: Ned Davis Research, 1/09. The S&P 500 Index is a composite of the 500 largest companies in the United States. INDEX PAST PERFORMANCE IS NOT INDICATIVE OF FUTURE RESULTS. This illustration is for illustrative purposes only, and does not represent the performance of The Hartford Mutual Funds, The Hartford variable annuities, or any particular investment. The S&P 500 Index is unmanaged. You cannot invest directly in the S&P 500 Index. Assumes reinvestment of income and no transaction cost. Market low for each crisis Crisis. Crisis. Crisis. Crisis. Crisis. Crisis. Crisis. Crisis. Crisis. Crisis. Crisis. Crisis. Crisis. Crisis. Crisis. Crisis. Crisis. Crisis. Crisis.
$87,802 Savings and Loan (S&L) Crisis & Recovery $66,340 • Unsound real-estate lending by S&Ls • Bank failures peak in 1988 and 534 banks close • Resolution Trust Corporation created to acquire and sell real-estate investments $51,953 12/31/89 3/31/87 A History of Financial Crises—and Recoveries 12/31/67 12/31/69 12/31/79 12/31/89 12/31/99 12/31/08 Data Source: Ned Davis Research, 1/09. The S&P 500 Index is a composite of the 500 largest companies in the United States. INDEX PAST PERFORMANCE IS NOT INDICATIVE OF FUTURE RESULTS. This illustration is for illustrative purposes only, and does not represent the performance of The Hartford Mutual Funds, The Hartford variable annuities, or any particular investment. The S&P 500 Index is unmanaged. You cannot invest directly in the S&P 500 Index. Assumes reinvestment of income and no transaction cost. Market low for each crisis Crisis. Crisis. Crisis. Crisis. Crisis. Crisis. Crisis. Crisis. Crisis. Crisis. Crisis. Crisis. Crisis. Crisis. Crisis. Crisis. Crisis. Crisis. Crisis.
Accounting Scandals, 9/11 Attacks & Recovery $535,260 $430,578 • Enron declares bankruptcy; other companies cited • Market down leading to Sarbanes-Oxley reforms • 9/11 – markets close for four days $262,973 6/30/07 10/31/99 A History of Financial Crises—and Recoveries 12/31/67 12/31/69 12/31/79 12/31/89 12/31/99 12/31/08 Data Source: Ned Davis Research, 1/09. The S&P 500 Index is a composite of the 500 largest companies in the United States. INDEX PAST PERFORMANCE IS NOT INDICATIVE OF FUTURE RESULTS. This illustration is for illustrative purposes only, and does not represent the performance of The Hartford Mutual Funds, The Hartford variable annuities, or any particular investment. The S&P 500 Index is unmanaged. You cannot invest directly in the S&P 500 Index. Assumes reinvestment of income and no transaction cost. Market low for each crisis Crisis. Crisis. Crisis. Crisis. Crisis. Crisis. Crisis. Crisis. Crisis. Crisis. Crisis. Crisis. Crisis. Crisis. Crisis. Crisis. Crisis. Crisis. Crisis.
The Credit Crunch $535,260 $332,392 • JP Morgan Chase buys out Bear Stearns • Washington Mutual – largest bank failure in U.S. history • Unemployment almost doubles; Consumer Confidence Index dropped to new low.* 6/30/07 12/31/08 A History of Financial Crises—and Recoveries 12/31/67 12/31/69 12/31/79 12/31/89 12/31/99 12/31/08 Data Source: Ned Davis Research, 1/09. *Data source: Bureau of Labor Statistics, 2/09; The Conference Board, 2/09.The S&P 500 Index is a composite of the 500 largest companies in the United States. INDEX PAST PERFORMANCE IS NOT INDICATIVE OF FUTURE RESULTS. This illustration is for illustrative purposes only, and does not represent the performance of The Hartford Mutual Funds, The Hartford variable annuities, or any particular investment. The S&P 500 Index is unmanaged. You cannot invest directly in the S&P 500 Index. Assumes reinvestment of income and no transaction cost. Market low for each crisis Crisis. Crisis. Crisis. Crisis. Crisis. Crisis. Crisis. Crisis. Crisis. Crisis. Crisis. Crisis. Crisis. Crisis. Crisis. Crisis. Crisis. Crisis. Crisis.
$228,033 Initial Investment $10,000 1/1/68 11/30/73 9/30/74 10/31/87 8/31/98 12/31/08 Reacting to Crisis: Short-Term Problem or Long-Term Opportunity? $487,346 $443,913 $332,767 * * * * * Opportunistic Investor adds $2,000 to stocks * * * * * Apprehensive Investor moves $2,000 to CDs Opportunistic—Adds$2,000 each time the market drops by 10% or more in a month. Total investment: $20,000 Systematic1—Investsan additional $10,000 over the entire period by adding $20.45 at the end of each month. Total investment: $20,000 Steadfast—Neitheradds nor subtracts. Total investment: $10,000 Apprehensive—Moves$2,000 to CDs* each time the market drops by 10% or more in a month. Total investment: $10,000 * CDs are FDIC insured up to $250,000 through 12/31/2009, offer a fixed rate of return, and are not subject to market volatility. Equity investments are subject to market volatility and have greater risk than CDs and other cash investments. 1 Continuous or periodic investment plans neither assure a profit nor protect against loss in declining markets. Systematic investing does provide an easy, disciplined way to build contract /account value. Because systematic investing involves continuous investing regardless of fluctuating price levels, you should carefully consider your financial ability to continue investing through periods of fluctuating prices. Data Source: Ned Davis Research, 1/09. The S&P 500 Index is a composite of the 500 largest companies in the United States. INDEX PAST PERFORMANCE IS NOT INDICATIVE OF FUTURE RESULTS. This illustration is for illustrative purposes only, and does not represent the performance of The Hartford Mutual Funds, The Hartford variable annuities, or any particular investment. The S&P 500 Index is unmanaged. You cannot invest directly in the S&P 500 Index. Assumes reinvestment of income and no transaction cost.
100%66 out of 66 periods 97%69 out of 71 periods 88%67 out of 76 periods 5-Year 10-Year 15-Year How Risky are Stocks in the Long Run? Percentage of Rolling Periods With Positive Returns for the S&P 500 Index 12/31/28 – 12/31/08 Data Source: Ned Davis Research, 1/09.The S&P 500 Index is a composite of the 500 largest companies in the United States. INDEX PAST PERFORMANCE IS NOT INDICATIVE OF FUTURE RESULTS. This illustration is for illustrative purposes only, and does not represent the performance of The Hartford Mutual Funds, The Hartford variable annuities, or any particular investment. The S&P 500 Index is unmanaged. You cannot invest directly in the S&P 500 Index. Assumes reinvestment of income and no transaction cost.
The Confidence to Invest in Bear Markets What You Would Have Missed Average Annual Returns When Investing After a 20% Drop for the Past 10 Bear Markets A bear market is defined by a 20% drop in the market.Data Source: Ned Davis Research, 1/09. The first bear market examined began on 6/15/48 and the last one began on 3/19/02. The S&P 500 Index is a composite of the 500 largest companies in the United States. INDEX PAST PERFORMANCE IS NOT INDICATIVE OF FUTURE RESULTS. This illustration is for illustrative purposes only, and does not represent the performance of The Hartford Mutual Funds, The Hartford variable annuities, or any particular investment. The S&P 500 Index is unmanaged. You cannot invest directly in the S&P 500 Index. Assumes reinvestment of income and no transaction cost.
Personal Steps: What We’ve Learned Work With a Financial Advisor Understand the Importance of Having a Financial Strategy Diversify Your Investment Portfolio Don’t Succumb to “Media Vision” Diversification does not assure a profit nor protect against a loss.
The Hartford: Profile of an Industry Leader Market Profile • Named by Ethisphere Institute as one of the 2009 World’s Most Ethical Companies • Winner of multiple DALBAR Service Awards in 2008: Annuity, Mutual Fund, Life Insurance, Retirement Plans Investments & Life Insurance • #2 provider of broker-sold variable annuities, based on assets in U.S.– Morningstar, December 2008 • #2 in variable universal life insurance sales – Tillinghast, December 2008 • #2 in group life sales – LIMRA, Sept. 2008 • #1 in new fully insured group disability insurance sales – LIMRA, September 2008 Property & Casualty Insurance • #4 direct writer of personal lines – 2008 Financial Statements • #2 for “Satisfying New Insurance Buyers with the Purchase Experience” by J.D. Powers and Associates 2008 Insurance New Buyer Study
A History of Helping America Recover Fire destroys New York’s financial district The Hartford’s president travels 108 miles through a blizzard to pay The Hartford's fire insurance customers. Terrorists attack the World Trade Center & Pentagon The Hartford pays more than $850 million to policyholders. San Francisco earthquake & Hurricane HugoThe Hartford pays claims to victims. A massive earthquake in San Francisco The Hartford pays $11.6 million in claims. 1835 1871 1989 1992 2001 2005 1906 The Great Chicago FireThe Hartford pays all claims, totaling almost $2 million. Hurricanes Katrina & Rita The Hartford pays claims totaling $140 million. Hurricane Andrew The Hartford is there for its policyholders.
“Confidence will gradually return to our financial markets, and the result will be a stronger financial system that extends beyond our nation’s borders.” The Hartford’s Chief Investment Strategist, Dr. Quincy Krosby The views expressed here are those of Dr. Quincy Krosby. Dr. Quincy Krosby's views are not necessarily those of The Hartford and should not be construed as investment advice.
You should carefully consider the investment objectives, risks, charges and expenses of The Hartford Mutual Funds and Hartford variable products and their underlying funds before investing. This and other information can be found in the prospectuses for the Mutual Funds and variable products and the prospectuses for the underlying funds, which can be obtained from your investment representative or by calling: 888-843-7824 for Hartford Mutual Funds, 800-862-6668 for Hartford variable annuities, or by logging on to our Web site (www.hartfordinvestor.com) for Hartford variable life insurance. Please read the applicable prospectus carefully before you invest or send money. This information is written in connection with the promotion or marketing of the matter(s) addressed in this material. The information cannot be used or relied upon for the purpose of avoiding IRS penalties. These materials are not intended to provide tax, accounting or legal advice. As with all matters of a tax or legal nature, you should consult your own tax or legal counsel for advice. The views expressed here are those of Dr. Quincy Krosby. Dr. Quincy Krosby's views are not necessarily those of The Hartford and should not be construed as investment advice. Hartford Mutual Funds are underwritten and distributed by Hartford Investment Financial Services, LLC. Hartford variable annuities are issued by Hartford Life Insurance Company and Hartford Life & Annuity Insurance Company and are underwritten and distributed by Hartford Securities Distribution Company, Inc. Variable annuities are long-term investment vehicles designed for retirement purposes and are subject to market fluctuation, investment risk, and possible loss of principal. Taxable distributions (and certain deemed distributions) are subject to ordinary income tax, and if made prior to age 59½, may also be subject to a 10% federal income tax penalty. Early surrender charges may also apply. Withdrawals will reduce the death benefit and cash surrender value. Hartford variable life insurance products are distributed by Hartford Equity Sales Company, Inc. (HESCO), a broker/dealer affiliate of The Hartford. “The Hartford” is The Hartford Financial Services Group, Inc. and its subsidiaries, including issuing company Hartford Life Insurance Company and Hartford Securities Distribution Company, Inc. (“HSD”). HSD (member FINRA and SIPC), a registered broker/dealer affiliate of The Hartford, has established certain service programs for retirement plans, including defined contribution retirement plans, through which a plan or plan participant may invest in mutual funds. This seminar has been funded in whole or in part by PLANCO Financial Services, LLC, a broker dealer affiliate of The Hartford. All information and representations herein are as of 5/09. SEM_CTC 08-6977A ANN 12858 5/09