Download
1 / 16
160 likes | 273 Views
PowerPoint: Charts. Computer Information Technology Section 5-12. Some text and examples used with permission from: http://www.jegsworks.com Note: We are not endorsing or promoting religious doctrine, but simply taking advantage of this website for educational purposes.

E N D
PowerPoint:Charts Computer Information Technology Section 5-12 Some text and examples used with permission from: • http://www.jegsworks.com • Note: We are not endorsing or promoting religious doctrine, but simply taking advantage of this website for educational purposes.
PowerPoint: Tables and Charts • Objectives: • The student will: • Understand the different types of charts available • Know how to create a chart • Know how to get data into the chart
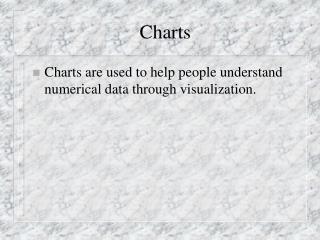
Charts A Picture Is Worth a Thousand Words
Charts A Picture Is Worth a Thousand Words A chart is a way to represent numbers graphically, that is, as a picture. There are many different types of charts.
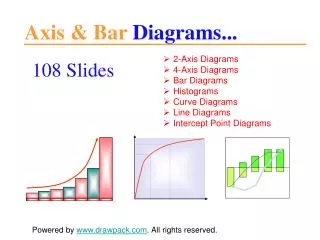
Chart Types • Column: • A column chart shows data changes over a period of time or illustrates comparisons among items. Categories are organized horizontally, values vertically, to emphasize variation over time.
Chart Types • Bar • A bar chart illustrates comparisons among individual items. Categories are organized vertically, values horizontally, to focus on comparing values and to place less emphasis on time.
Chart Types • Line • A line chart shows trends in data at equal intervals.
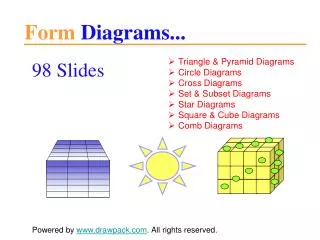
Chart Types • Area • An area chart emphasizes the magnitude of change over time. By displaying the sum of the plotted values, an area chart also shows the relationship of parts to a whole.
Chart Types • Pie • A pie chart shows the proportional size of items that make up a data series to the sum of the items. It always shows only one data series and is useful when you want to emphasize a significant element.
Chart Types • Other types: • XY (scatter) • Bubble • Cone, Cylinder and Pyramid • Doughnut • Stock • Surface • Radar
Creating a Chart • There are 2 ways to create a chart: • From the Illustrations group on the Insert tab by clicking on • From the layouts
Creating a Chart • Clicking the Chart button or icon opens excel spreadsheet and a chart based on the datasheet.
Creating a Chart • You must remove the default data and enter your own data in the datasheet. • Once you have your own data entered, you can change the chart type and change the formatting, too. • Unfortunately you cannot select data in an existing PowerPoint table and use it to create a chart automatically. You can, however, Copy and Paste data into the datasheet.
Summary • There are many different kinds of charts • Choose the chart type that best reflects the message you want to convey • PowerPoint creates a dummy chart when you insert a new chart. • You need to change the data • You can copy and paste a table into the datasheet.
Rest of Today • Finish HW 5-11 (the table) – nicely format the table – Add your name and period in the footer section (Insert tab - Header and Footer). Add a title in table or on the slide. Print and turn in. • Start HW5-12 (a chart) • In a new PowerPoint file, create a chart • Copy the data from your table into the chart • Save this as Homework 5-12 • Tomorrow • You will learn options for formatting the chart