Download
1 / 14
140 likes | 146 Views
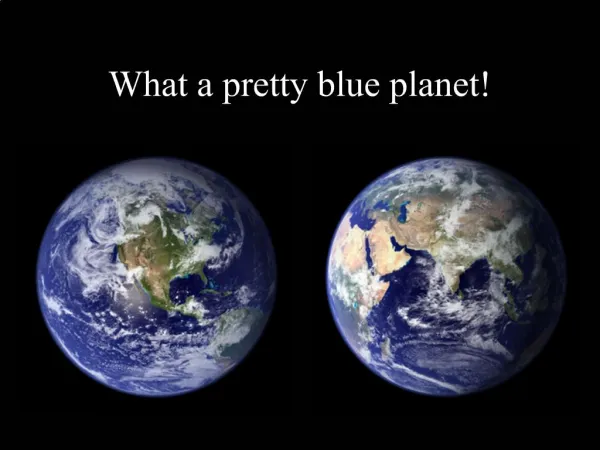
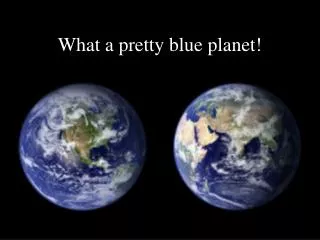
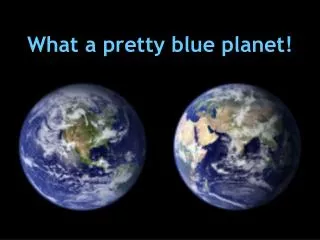
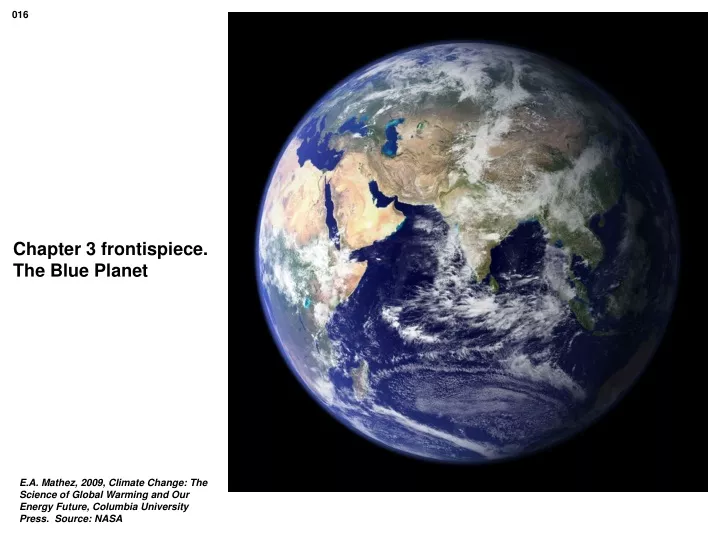
Explore the composition of seawater, ocean surface salinity, density, temperature, and global ocean currents, and their impact on climate change.

E N D
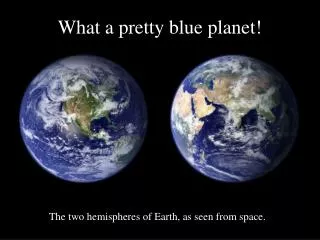
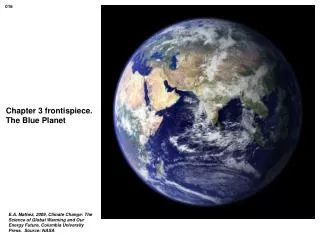
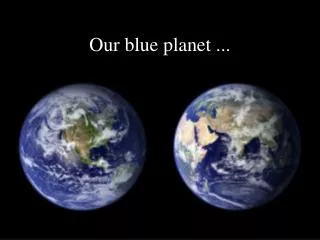
016 Chapter 3 frontispiece. The Blue Planet E.A. Mathez, 2009, Climate Change: The Science of Global Warming and Our Energy Future, Columbia University Press. Source: NASA
017 Figure 3.1. The water molecule E.A. Mathez, 2009, Climate Change: The Science of Global Warming and Our Energy Future, Columbia University Press.
018 Figure 3.2. The composition of seawater E.A. Mathez, 2009, Climate Change: The Science of Global Warming and Our Energy Future, Columbia University Press.
019 Figure 3.3. The average annual salinity of ocean surface water, 2005 E.A. Mathez, 2009, Climate Change: The Science of Global Warming and Our Energy Future, Columbia University Press. Source: NOAA
020 Figure 3.4. Vertical profiles of density, temperature, and salinity through the upper several hundred meters of the ocean E.A. Mathez, 2009, Climate Change: The Science of Global Warming and Our Energy Future, Columbia University Press. Source: Denman and Miyake, 1973
021 Figure 3.5. A conductivity, temperature, and depth measurement device E.A. Mathez, 2009, Climate Change: The Science of Global Warming and Our Energy Future, Columbia University Press. Photograph by E.A. Mathez
022 Figure 3.6. The global ocean surface currents E.A. Mathez, 2009, Climate Change: The Science of Global Warming and Our Energy Future, Columbia University Press. Source: Hartmann, 1994
023 Figure 3.7. False-color satellite image of the Gulf Stream along the eastern United States and its eddies E.A. Mathez, 2009, Climate Change: The Science of Global Warming and Our Energy Future, Columbia University Press. Source: MODIS Atmosphere Team, University of Wisconsin
024 Figure 3.8. The global ocean conveyor system E.A. Mathez, 2009, Clmate Change: The Science of Global Warming and Our Energy Future, Columbia University Press. Source: IPCC, 2001
025 Table 3.1. The water balance of the continents and oceans Region Evapotranspiration Precipitation Runoff (in millimeters/year) Europe/Asia 795 1353 558 Africa 582 696 114 North America 403 645 242 South America 946 1,564 618 All land 480 746 266 Atlantic Ocean 1,133 761 –372 Indian Ocean 1,294 1,043 –251 Pacific Ocean 1,202 1,292 90 All oceans 1,176 1,066 –110 E.A. Mathez, 2009, Climate Change: The Science of Global Warming and Our Energy Future, Columbia University Press. Source: Hartmann, 1994
026 Figure 3.9. The correlation between annual maize yield and sea-surface temperature in the eastern equatorial Pacific E.A. Mathez, 2009, Climate Change: The Science of Global Warming and Our Energy Future, Columbia University Press. Source: Cane et al., 1994
027 (a) (b) Figure 3.10. Shifts in sea-surface temperatures, winds, and positions of the jet streams in (a) normal and (b) El Niño years E.A. Mathez, 2009, Climate Change: The Science of Global Warming and Our Energy Future, Columbia University Press. Source: Krishna Ramanujan, NASA
028 Figure 3.11. Convective atmospheric circulation along the equator, also known as Walker circulation E.A. Mathez, 2009, Climate Change: The Science of Global Warming and Our Energy Future, Columbia University Press. Source: Webster, 1983
029 Figure 3.12. The Southern Oscillation Index and corresponding variations in eastern equatorial sea-surface temperature E.A. Mathez, 2009, Climate Change: The Science of Global Warming and Our Energy Future, Columbia University Press. Source: McPhaden et al., 2006