Download
1 / 1
20 likes | 158 Views
The Relationship Between Maximal Fat Oxidation Rates and Blood Lactate Thresholds in Runners. Orme 1 , D., Relph 1 ,N., and Sparks 2 , S.A 1 Department of Sport and Physical Activity, University of Cumbria, Lancaster, Lancashire, UK.

E N D
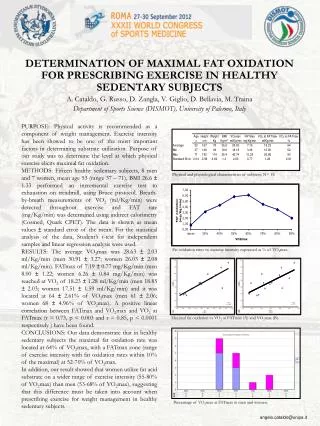
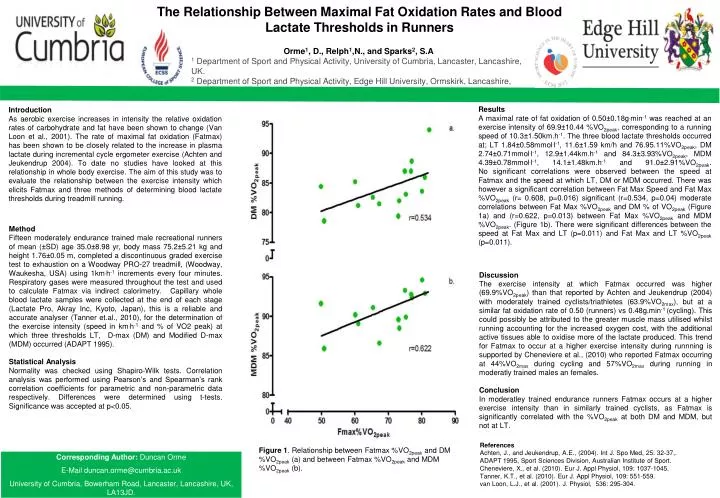
The Relationship Between Maximal Fat Oxidation Rates and Blood Lactate Thresholds in Runners Orme1, D., Relph1,N., and Sparks2, S.A 1 Department of Sport and Physical Activity, University of Cumbria, Lancaster, Lancashire, UK. 2 Department of Sport and Physical Activity, Edge Hill University, Ormskirk, Lancashire, UK. Results A maximal rate of fat oxidation of 0.50±0.18g.min-1 was reached at an exercise intensity of 69.9±10.44 %VO2peak, corresponding to a running speed of 10.3±1.50km.h-1. The three blood lactate thresholds occurred at; LT 1.84±0.58mmol.l-1, 11.6±1.59 km/h and 76.95.11%VO2peak, DM 2.74±0.71mmol.l-1, 12.9±1.44km.h-1 and 84.3±3.93%VO2peak, MDM 4.39±0.78mmol.l-1, 14.1±1.48km.h-1 and 91.0±2.91%VO2peak. No significant correlations were observed between the speed at Fatmax and the speed at which LT, DM or MDM occurred. There was however a significant correlation between Fat Max Speed and Fat Max %VO2peak (r= 0.608, p=0.016) significant (r=0.534, p=0.04) moderate correlations between Fat Max %VO2peak and DM % of VO2peak (Figure 1a) and (r=0.622, p=0.013) between Fat Max %VO2peak and MDM %VO2peak. (Figure 1b). There were significant differences between the speed at Fat Max and LT (p=0.011) and Fat Max and LT %VO2peak (p=0.011). Introduction As aerobic exercise increases in intensity the relative oxidation rates of carbohydrate and fat have been shown to change (Van Loon et al., 2001). The rate of maximal fat oxidation (Fatmax) has been shown to be closely related to the increase in plasma lactate during incremental cycle ergometer exercise (Achten and Jeukendrup 2004). To date no studies have looked at this relationship in whole body exercise. The aim of this study was to evaluate the relationship between the exercise intensity which elicits Fatmax and three methods of determining blood lactate thresholds during treadmill running. Method Fifteen moderately endurance trained male recreational runners of mean (±SD) age 35.0±8.98 yr, body mass 75.2±5.21 kg and height 1.76±0.05 m, completed a discontinuous graded exercise test to exhaustion on a Woodway PRO-27 treadmill, (Woodway, Waukesha, USA) using 1km.h-1 increments every four minutes. Respiratory gases were measured throughout the test and used to calculate Fatmax via indirect calorimetry. Capillary whole blood lactate samples were collected at the end of each stage (Lactate Pro, Akray Inc, Kyoto, Japan), this is a reliable and accurate analyser (Tanner et.al., 2010), for the determination of the exercise intensity (speed in km.h-1 and % of VO2 peak) at which three thresholds LT, D-max (DM) and Modified D-max (MDM) occurred (ADAPT 1995). Statistical Analysis Normality was checked using Shapiro-Wilk tests. Correlation analysis was performed using Pearson’s and Spearman’s rank correlation coefficients for parametric and non-parametric data respectively. Differences were determined using t-tests. Significance was accepted at p<0.05. Discussion The exercise intensity at which Fatmax occurred was higher (69.9%VO2peak)than that reported by Achten and Jeukendrup (2004) with moderately trained cyclists/triathletes (63.9%VO2max), but at a similar fat oxidation rate of 0.50 (runners) vs 0.48g.min-1 (cycling). This could possibly be attributed to the greater muscle mass utilised whilst running accounting for the increased oxygen cost, with the additional active tissues able to oxidise more of the lactate produced. This trend for Fatmax to occur at a higher exercise intensity during runnning is supported by Cheneviere et al., (2010) who reported Fatmax occurring at 44%VO2max during cycling and 57%VO2max during running in moderatly trained males an females. Conclusion In moderatley trained endurance runners Fatmax occurs at a higher exercise intensity than in similarly trained cyclists, as Fatmax is significantly correlated with the %VO2peak at both DM and MDM, but not at LT. References Achten, J., and Jeukendrup, A.E., (2004). Int J. Spo Med, 25: 32-37,. ADAPT 1995, Sport Sciences Division, Australian Institute of Sport. Cheneviere, X., et al. (2010). Eur J. Appl Physiol, 109: 1037-1045. Tanner, K.T., et al. (2010). Eur J. Appl Physiol, 109: 551-559. van Loon, L.J., et al. (2001). J. Physiol, 536: 295-304. Figure 1. Relationship between Fatmax %VO2peak and DM %VO2peak (a) and between Fatmax %VO2peak and MDM %VO2peak (b). Corresponding Author: Duncan Orme E-Mail duncan.orme@cumbria.ac.uk University of Cumbria, Bowerham Road, Lancaster, Lancashire, UK, LA13JD.