Download
1 / 7
180 likes | 330 Views
The concept of Lactate threshold (LT) and ventilatory threshold (VT) have been broadly applied to evaluate endurance capacity during the sports training.

E N D
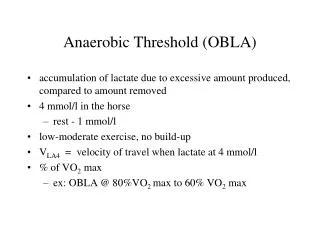
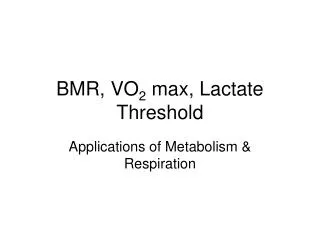
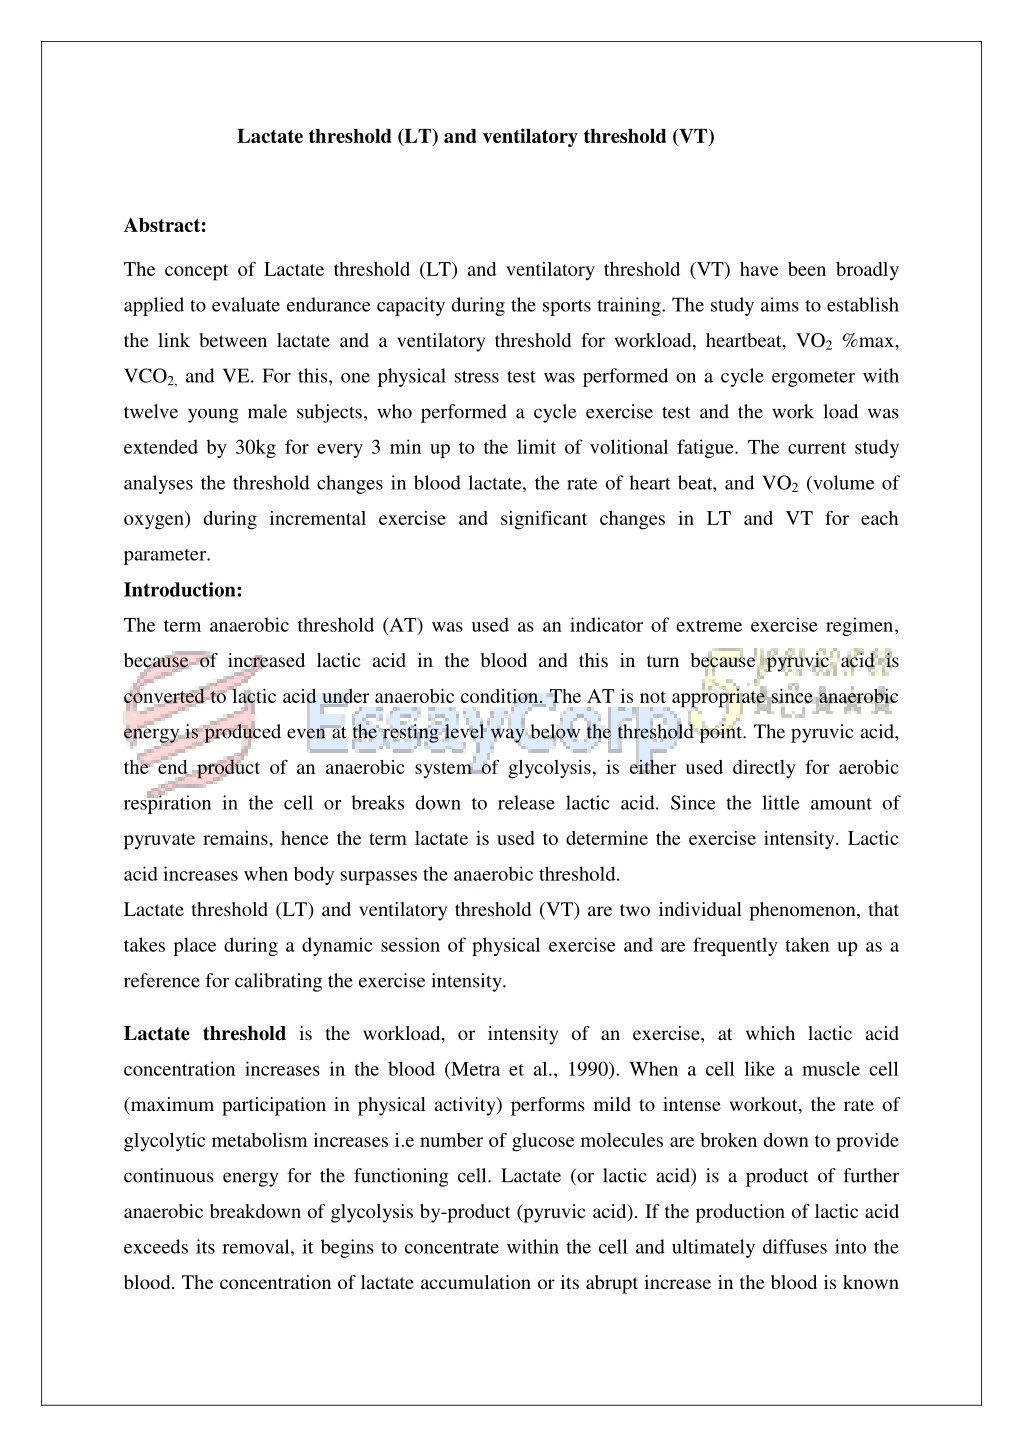
Lactate threshold (LT) and ventilatory threshold (VT) Abstract: The concept of Lactate threshold (LT) and ventilatory threshold (VT) have been broadly applied to evaluate endurance capacity during the sports training. The study aims to establish the link between lactate and a ventilatory threshold for workload, heartbeat, VO2 %max, VCO2, and VE. For this, one physical stress test was performed on a cycle ergometer with twelve young male subjects, who performed a cycle exercise test and the work load was extended by 30kg for every 3 min up to the limit of volitional fatigue. The current study analyses the threshold changes in blood lactate, the rate of heart beat, and VO2 (volume of oxygen) during incremental exercise and significant changes in LT and VT for each parameter. Introduction: The term anaerobic threshold (AT) was used as an indicator of extreme exercise regimen, because of increased lactic acid in the blood and this in turn because pyruvic acid is converted to lactic acid under anaerobic condition. The AT is not appropriate since anaerobic energy is produced even at the resting level way below the threshold point. The pyruvic acid, the end product of an anaerobic system of glycolysis, is either used directly for aerobic respiration in the cell or breaks down to release lactic acid. Since the little amount of pyruvate remains, hence the term lactate is used to determine the exercise intensity. Lactic acid increases when body surpasses the anaerobic threshold. Lactate threshold (LT) and ventilatory threshold (VT) are two individual phenomenon, that takes place during a dynamic session of physical exercise and are frequently taken up as a reference for calibrating the exercise intensity. Lactate threshold is the workload, or intensity of an exercise, at which lactic acid concentration increases in the blood (Metra et al., 1990). When a cell like a muscle cell (maximum participation in physical activity) performs mild to intense workout, the rate of glycolytic metabolism increases i.e number of glucose molecules are broken down to provide continuous energy for the functioning cell. Lactate (or lactic acid) is a product of further anaerobic breakdown of glycolysis by-product (pyruvic acid). If the production of lactic acid exceeds its removal, it begins to concentrate within the cell and ultimately diffuses into the blood. The concentration of lactate accumulation or its abrupt increase in the blood is known
as the Lactate Threshold (LT) or the highest workload one can sustain without excess lactate accumulation. Potential physiological causes of lactate threshold are low muscle O2, accelerated glycolysis to meet energy demands and reduced rate of lactate removal. LT can be determined by three methods: 1) Two‐Line Regression Model (Beaver et al., 1986) 2) Analysing Blood Lactate Concentrations 3) Individual Anaerobic Threshold The LT determination is done by analyzing the lactate levels in arterial blood, an invasive procedure which has drawn scientist to improvise it and use non-invasive methods. VT or ventilatory threshold is a non- invasive parameter and based on the analysis of the respiratory exchange (Wyatt 1999). Ventilatory Threshold is the inflection point for ventilation during an incremental exercise trial. When physical intensity increases gradually, the breathing rate i.e ventilation also increases in a linear fashion. However, with increasing exercise intensity, there eventually comes a point from where ventilation increment takes a non-linear curve; known as the ventilatory threshold. Oxygen consumption and ventilation increases at the same rate up to 50-70% of VO2max (aerobic capacity). Beyond the point of ventilatory threshold, ventilation increases exponentially. Similar protocol is followed for VT determination and LT, but three main methods used for the analysing the VT are 1.Ventilation curve: The graph is plotted against VE vs. VO2 or Watts (WL) vs. Time (min). The point of non‐linear increase is measured as ventilation threshold. 2.V‐slope method: The graph is plotted against VO2 / VCO2. VT is the point at which the increase in VCO2 > than VO2 3.Ventilatory equivalents method Ventilatory threshold is a point where oxygen uptake to the muscle cells becomes a limiting factor and the body shifts towards the anaerobic energy system. As a result, lactate levels start risen up, much faster than it is cleared; making the blood becomes more acidic. Blood buffers, compounds that help neutralize acidosis in muscle fibers by bicarbonate system
increases the levels of carbon dioxide, which body tries to, and eliminate the excess of blood pCo2 by increasing ventilation. Lactic acid-----Lactate- + H+ H+ + HCO3- H2CO3 H2O + CO2 Fig: Physiological basis for VT At this juncture, breathing becomes faster and more laboured and the physical intensity increases. It was previously considered that both the VT and LT might occur at similar physical intensity, because ventilation increases with physical intensity and at higher blood lactate levels. But it appears that both LT and VT can occur at slightly different physical intensities, which may depends upon factors like individual’s nutrition level and fitness strength, but practically, both reached at roughly similar exercise intensities. The transition from small amounts of lactic acid to large amounts occurs over a narrow range of energy and, in fact, nearly coincides with the ventilatory threshold. The current research is based on the hypothesis that LT and VT will occur at the same time during incremental cycle ergometry. Methods The subjects of the study were 12 males of sports science department, with an average age of 19.8± 1.23 yrs. Before participating in the study, the height and weight of each subject involved in the study were taken and each subject was well informed of the experimental procedure and the risks associated. For the experiment procedure following type of equipments were used: Cycle ergometer, gas analysers , mouthpiece , rubber gloves , lactate analyser, nose clip , dry gas meters, breathing valves, sharps bin sterile swabs, Douglas bags , tissues, clinical waste bag, and auto clip Experimental procedure:
After the initial blood sample, all the 12 subjects perform one physical stress exercise test on a cycle ergometer to determine the LT/VT. The saddle height for each participant was adjusted according to their height, and the angle at the knee, when the pedal is at the bottom position, is approximately 160 degrees. Work load (W) is increased by 30 watts by every three minutes i.e from 90 W to 240 W and heart beat was monitored at each interval. Three minutes time schedule was set for each category workload (WL) and heart rate was measured for every 15s interval during the last minute session of exercise. Expired gas samples were collected from each subject during the last minute of the exercise regimen. Capillary blood samples were taken when the last 30sec of each work load schedule is running. Blood lactate was assayed with an enzymatic spectrophotometer. Heart beat data was collected via heart beat monitor. The data from all the 12 subjects was collected and the graph was plotted to determine the LT and VT using the breakpoint method. The significance level was set at p<0.05 for all the analysis. The slopes were determined by the linear regression analysis with their respective thresholds. For all statistical procedures, SPSS Statistics (IBM) and Excel (Microsoft) were used. Paired sample t-test was used to compare the mean values and standard deviation for LT and VT against variables. Results The observations were made to determine the relationship between LT and VT. The data for LT and VT was analysed for six parameters workload (W), heart rate (HR), VO2 (L.min-1), VO2 (%max), VCO2 (L.min-1) and ventilation VE (L.min-1) for all the 12 participants (n). Table 1 contains descriptive data for 12 subjects (n). They had a mean weight of 74.3 ± 5.71, and mean height of 1.78±0.08. The mean standard deviation for VO2 max (L /min) was 3.44±0.48. P value and statistical significance of paired LT and VT variables (paired t test): 1.Work load (W) LT-VT The mean ± SD for LT and VT was 172.5±36.4 and 177.5± 32.5 The two-tailed P value equals 0.5505, hence considered insignificant as p>0.05 n=12 2.Heart Rate LT - Heart Rate VT . The mean ± SD for LT and VT was 172.50 ± 36.46 and 177.50± 32.51. The two- tailed P value equals 0.7263. Hence this difference is considered to be not statistically
significant 3.VO2 max LT - VO2max VT Mean for LT=2.508 Mean for VT=2.408 SD 0.530 0.425 The two-tailed p- value equals 0.4877, hence statistically non significant 4.VO2% max LT-VT Mean± SD for, LT= 72.25±8.3, and VT= 72.3±9.5 The two tailed p -value =0.9686, non significant 5.VCO2 LT- VCO2 VT Mean± SD, LT=2.55±0.70, and VT=2.44±0.51 The two tailed p- value =0.5449; non- significant 6.VE LT-VT Mean± SD, LT= 64.65±14.99 and VT=62.183±12.11 The two-tailed P value equals 0.571; non- significant The above result shows the means and standard deviation between LT and VT for six parameters. The difference was found to be not significant for LT and VT when compared with WL, HR, VO2 max, VCO2, and VE. This clearly favours the simultaneous occurrence of LT and VT. Table 3 which represent individual’s physiological data, clearly depicts that the blood lactate concentration increased linearly as the work load increases. BLC shoots to 6.3mmol/L when workload increases to 240 watts. With incremental exercise, the % of VO2 max increases linearly with VE, with a mean average of 72.6 and population st.dev of 22.4. The first graph for determining lactate threshold test was performed on a cycling ergometer. It represents breakpoint analysis of blood lactate concentration versus workload of the 12 participants. As per the graph, initial 1 mmol/L of lactic acid concentration shoots to 1.3 mmol/L, which occurred at 150 watts of work load. Therefore, the lactate threshold (LT) point is at 150 watts. The second graph represents breakpoint analysis of ventilation versus workload of 12 participants. The threshold or breakpoint as a function of VO2max was determined as the point where deviation is observed in linearity when the data was analyzed by non-linear regression analysis. From there, it can be concluded that VT also occurred around 150 watts.
While analysing the pre and post threshold slopes for Heart Rate (HR), it was found that maximum participants verified either an increased or decreased response post-threshold. Discussion For all the six variables, the LT and VT occur simultaneously as there was no significance difference noted. The result is in accordance with Belli et al., 2007 which supported the fact that both VT and LT can be used to access the exercise intensity concurrently During any physical test, blood lactate level is commonly used to evaluate the effects of training, to help setting up of physical intensities, and to maximize and predict performance. The finding of this study was that the oxygen consumption i.e VO2% max was significantly elevated at both LT and VT. Accumulated data suggest that exercise intensities derived from the LT may provide the best indices by which to prescribe guidelines for training. Through the above study, it can be concluded that LT and VT occur simultaneously during incremental cycle ergometry. VO2 max may also provide a useful indication of the aerobic capacity. However, a further research should be done to increase the number of subjects with varying degree health and fitness that can sufficiently conclude the co-occurrence of LT and VT. References 1.Beaver, W., Wasserman, K.,and Whipp, B. (1986). A new method for detecting anaerobic threshold by gas exchange. Journal of Applied Physiology, 60(6), 2020‐2027. 2.Belli, T., Ackermann, MA., Ribeiro, L.F., Langeani, R., GAldino da Silva, R and BAldisserva, V.(2007). Lactate and ventilatory thresholds in type 2 diabetic women. Diabetes Res Clin Pract, Apr. 76(1):18-23. 3.Chris Schwirian http:// www. Biosci.ohiou.edu/faculty/schwirian 4.Metra, M., Raddino R., DeiCAs L, and Vissioli, O. (1990). Assessment of peak oxygen consumption, lactate and ventilatory thresholds and correlation with resting and exercise hemodynamic data in chronic congestive heart failure. Am J Cardiol. May 1; 65(16):1127-33. 5.Wyatt FB: (1999). Comparison of lactate and ventilatory threshold to maximal oxygen consumption: a meta-analysis. Journal of Strength & Conditioning Research (Allen Press Publishing Services Inc), 13:67-71.