Download
1 / 16
160 likes | 258 Views
Explore ultrasonic techniques for inspecting challenging materials in small geometries such as foam shells and cryogenic targets, eliminating the need for multiple chemical exchanges. Recent activities include data collection on foam samples and preliminary data on spherical shells. The High Pressure Gas-Coupled Ultrasound (HPGCU) system is discussed, along with metrology and thickness measurements using ultrasound. Conclusions highlight the unique capabilities of acoustic microscopy in target fabrication facilities.

E N D
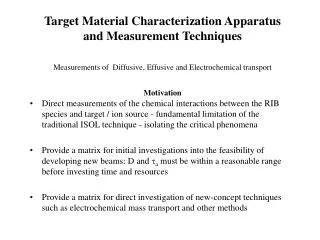
Ultrasonic characterization of inertial confinement fusion targetsKSM EDITED VERSIONHigh Average Power Laser (HAPL) Program MeetingOctober 27-28, 2004Princeton Plasma Physics LaboratoryPrinceton, New Jersey, USAL.J. Bonda, M.S. Gooda and D. SchroenbaPacific Northwest National LaboratoryRichland, Washington, USAbSchafer Corporation, Livermore, California, USA
Target Characterization Requirements Inspection of challenging materials in small geometries – spheres and cylinders maximum dimensions few mm • Low density foam: • Divinyl Benzene (DVB) foam shells • Cylindrical samples of TPX foam – shells and cylinders for density anomalies and dimensions • Cryogenic targets at ~ 15K which contain deuterium ice layer
High Pressure Gas-Coupled Acoustic Measurements Pulse-echo demonstrated by: Wickramasinghe & Petts (1980) Transmission measurements (Bond 1992) High pressure gas has lower attenuation for ultrasound No liquid couplant required Recent application membrane compaction and recovery (Reinsch et. al. 2000) Preliminary data reported HAPL MEETINGS February & June 2004 BACKGROUND
RECENT ACTIVITIES: Data taken on TPX Foam Cylinders and DVB Foam Spherical Shell Gas-coupled: Initial 1-D scanned Images from TPX Foam Samples Water-coupled: Preliminary data to characterize DVB Foam Spherical Shell Capsules just after gellation Measure wall thickness and concentricity Proposed Technique: Use 50-MHz transducer array Benefit:ultrasonic technique would eliminate multiple chemical exchanges required by the current optical technique, expedite production, and significantly reduce the solvent waste stream. BACKGROUND (cont’d)
High Pressure Gas CoupledUltrasound (HPGCU) System A. Pressurized Gas Cylinder B. Pressure Vessel C. Pressure Gage Read Out D. Ultrasonic Electronics E. Data Cables to Computer F. Motor Controller G. Motor Interface H. Camera Monitor of Scanner within Pressure Vessel C F B H D A G D D E
Components within Pressure Vessel Pressure Vessel Motor 1-Axis Scanner Pressure Vessel Head Shaft Linear Slide Camera Monitor Sample Mount Color-Scale Modulated by Amplitude Sensor Position X (µm) Transducer Sample Transducer Gimbal Depth (µm) Image Concept
Transducer Focal Characteristics • Resolution Pattern for Transducer Characterization • A Pattern of 0.125-mm Diameter, Nylon Monofilament Reflectors • Transducer: 3-MHz Frequency, 12.5-mm Focal Length Depth Displacement (mm) 8 10 12 14 16 18 Amplitude-Color Key Converging Field 9 mm Diverging Field Transducer Characterization Reference 0 2 4 6 8 10 12 14 16 Lateral Displacement (mm) (Not to Scale)
Surface Metrology Characterization A B D F E C G H 2 mm H 50 µmSurface Steps in Aluminum. A. 0 µm Datum, B. 50 µm, C.- 100 µm, D. 150 µm, E. - 200 µm, F. 250 µm, G.- 300 µm, H. Photographs B C D G A F E H 2 mm H 10 µmSurface Steps in Aluminum. A. 0 µm Datum, B. 10 µm, C.- 20 µm, D. 30 µm, E. - 40 µm, F. 50 µm, G.- 60 µm, H. Photographs D E G C F B A H 2 mm H 50 µmSurface Steps in TPX Foam. A. 0 µm Datum, B. - 50 µm, C.100 µm, D. - 150 µm, E. 200 µm, F. - 250 µm, G.300 µm, H. Photographs
Internal Metrology Characterization Relative Depth (mm) 0 2 4 6 8 10 12 0 5 10 15 Lateral Displacement (mm) Reference Step Block with Water Chamber Relative Depth (mm) 0 1 2 Plastic Sample Holder 0 5 10 15 20 25 Lateral Displacement (mm) TPX Foam Reference Step Block Not to Scale
TPX Foam Samples Not to Scale
Preliminary Data to Characterize DVB Foam Spherical Shell Capsules After Gellation:Thickness Measurement (WATER COUPLED) Amplitude (Screen Height Percent) Outer Surface: 0 µm DVB Spherical Shell Inner Surface: 300 µm • Excellent resolution exists to quantify thickness • Classic phase reversal pattern exists between responses • Outer Surface: Water to DVB saturated with water • Inner Surface: DVB saturated with water to water • High confidence exists in signal interpretation. Time (µs) is Proportional to Thickness Amplitude (Screen Height Percent) Peak Frequency: 37 MHz Frequency (MHz)
Amplitude (Screen Percentage) Δt Gated Portion of Signal B A Time (µs) Preliminary Data to Characterize Metal Spherical Shells During Production for Quality Control: Thickness Measurement Using Discrete Signals A B Sample 1: 90 µm Thickness Δt = 0.071 µs Surrogate: Glow Discharge Polymer coated PAMS shell Sample 3: 70 µm Thickness Δt = 0.056 µs Sample 2: 139 µm ThicknessΔt = 0.113 µs Source of samples: Haibo Huang, General Atomics
Preliminary Data to Characterize Metal Spherical Shells During Production for Quality Control: Thickness Measurement Using Spectroscopy Amplitude (Screen Percentage) Amplitude Spectrum of Gated Signal Sample 1: 90 µm Thickness Δf= 1/Δt Δf Frequency (MHz) Sample 2: 139 µm Thickness Sample 3: 70 µm Thickness Source of samples: Haibo Huang, General Atomics
Conclusions • Acoustic microscopy has unique characterization capabilities for two critical steps in the target fabrication production facility. • It can characterize gelled (opaque) foam shells without solvent exchanges to an indexed mated solvent.Optical characterization requires an exchange from isopropanol and future processing steps require an exchange back to isopropanol. Ultrasonic characterization eliminates two solvent exchange steps with the time and solvent waste associated with them. • It can characterize layered targets in both room temperature and a cryogenic environment.Ultrasonic characterization could be done just prior to injection to decrease the number of shells that do not produce high yield.
References • Bond, L.J. (1992) Through transmission gas and pulsed water-coupled microscopy of electronic packaging and composite materials. Report to NIST, University of Colorado at Boulder. • Reisch, V.E., Greenberg, A.R., Kelley, S.S., Peterson, R. and Bond, L.J. (2000) “A new technique for the simultaneous real-time measurement of membrane compaction and performance during exposure to high-pressure gas.” J. Membrane Science 171 pp. 217-228. • Wickramasinghe, H.K. and Petts, C.R. (1980) Gas medium acoustic microscopy, in Scanning Image Microscopy, ed. E.A. Ash, Academic Press (London) pp. 57-70.
For more information contact:Leonard J. Bond, Ph.D.Laboratory FellowPacific Northwest National LaboratoryP.O. Box 999, K5-26Richland, WA 99352email: leonard.bond@pnl.govPhone: 509-375-4486Morris S. Good, Ph.D.Staff Scientist and EngineerPacific Northwest National LaboratoryP.O. Box 999, K5-26Richland, WA 99352email: morris.good@pnl.govPhone: 509-375-2529