Download
1 / 27
270 likes | 378 Views
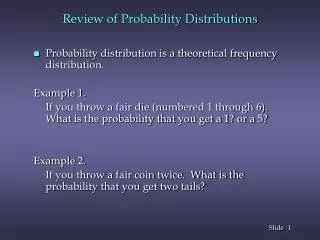
Review of Probability and Binomial Distributions. The Mathematics of Chance. How many possible outcomes are there with a single 6-sided die? What are your “chances” of rolling a 6? Can we generalize what you just did?. The gambler’s dispute (1654).

E N D
The Mathematics of Chance • How many possible outcomes are there with a single 6-sided die? • What are your “chances” of rolling a 6? • Can we generalize what you just did?
The gambler’s dispute (1654) • This famous dispute led to the formal development of the mathematical theory of probability "A gambler's dispute … a game consisted in throwing a pair of dice 24 times; the problem was to decide whether or not to bet even money on the occurrence of at least one "double six" during the 24 throws.
Let’s simulate this… • How many possible outcomes are there? • What fraction of these is a “double-six”? • How can we quantify the odds? • How many times would expect to get 6-6 in 24 tries? • How likely would it be to play this game 36 times and NOT get 6-6? You have a 36% chance of not getting 6-6 in 36 throws (1:2 odds) Link to Excel simulation
Defining Probability • We define probability by comparing an outcome or set of outcomes with the set of all possible outcomes for an event. • This will lead us to an “intuitive” definition of probability
Examples… • A coin toss: • Two possible outcomes H or T • Probability for H is 1 of the 2 or ½ = 0.5 = 50% • You win the “Stats 300 Lottery” • 39 possible outcomes • Only 1 of you! Probability is 1/39 = 2.5% • Odds of a full-house in Poker • There are 2,598,960 possible poker hands • There are 3,744 ways to get a full house or 3744/ 2,598,960 = 0.024% (1 in 4165 hands!)
Independent Events • When events are independent – the outcome (or probability) of the one does not change the probability of the other. • Example: • You flip a coin and get heads – what is the probability that you heads on the next flip? • NOTE – this is not the same as asking what is the probability of flipping two heads in succession
Probability of HH is(1/2)(1/2) = 1/4 Four Possible Outcomes
Probability Rules (for events)… • A probability of 0 means an event never happens • A probability of 1 means an event always happens • Probability P is a number always between 0 and 1
Probability Rules (for events)… • If the probability of an event A is P(A) then the probability that the event does not occur is 1-P(A) • This is also called the compliment of A and is denoted AC • Example: what is the probability of not rolling a 6 when using an honest die?Solution: P6 = 1/6, PC6 = 1 - 1/6 = 5/6
Probability Rules (in pictures)… • If events A and B are completely independent of each other (disjoint) then the probability of A or B happening is just:
Sample Questions… • What is the probability of flipping 5 successive heads? • What is the probability of flipping 3 heads in 5 tries? • From your text: 4.8, 4.13,4.14
Probability Rules (in pictures)… • If events A and B are independent of each other (but not disjoint) then the probability of A and B happening is just:
A motivating example… • 35% of Canadian university students work more than 20 hours/week in jobs not related to their studies. This can have a serious impact on their grades. What is the probability that I have at least 5 such students in this class? Answer: There is better than a 99% chance!
What is a Binomial Distribution? • Any random statistic that can be cast in a “yes/no” format where: • N successive choices are independent • “yes” has probability p and “no” has probability 1-p fits a binomial distribution. Suggest 3 other examples of data sets that can be modeled as binomial distributions
Looking a bit deeper… • Suppose someone offered you the following “game”: • Should you accept the bet? • What is your expected return on this bet? • How can we calculate the odds? Toss a coin 5 times. If you get 3 heads I pay you a dollar, otherwise you pay me 50 cents.
Pascal to the rescue! There are exactly 10 ways to get 3 heads What is the probabilityof flipping 6 tails in 8 trials?
How to generate Pascal’s Triangle • Pascal’s triangle “unlocks” the mystery of binomial distributions • The cells in the triangle represent binomial coefficients which also represent all possible “yes/no” combinations • In “math-speak” we use the following notation to calculate the number of ways “k” events can occur in “n” choices: Factorial notation5! = 5x4x3x2x1 = 120 How many ways can 3 people be selected from a class of 39?
Math detail (FYI) • The general binomial probability is: • The Binomial Table is built from these terms Example: B(9,0.4),what is P(5)?
How to use the binomial distribution • Assign “yes” and “no” and their respective probabilities to the instances in your problem • Assign “n” and “k” and either use the formula, look up in a table or use a stats package (Excel works well) • Example: 5.5 Look up in table Use formula 3 ways: Use Excel
From Binomial to Normal Distributions • Binomial is a discrete probability distribution • Normal is a continuous distribution • When n becomes very large we can often approximate by using a N(m,s) dist. • How large is “large”? Rule of Thumb: when np >= 10 and n(1-p) >= 10 we can use the Normal Distribution approximation
Sample Proportions… • We often are interested in knowing the proportion of a population that exhibits a specific property (statistic). We denote this the following way: • p is a proportion (often interpreted as a probability) and is therefore a number between 0 and 1
Mean and Standard Deviation of a Sample Proportion • If p is the proportion of “successes” in a large SRS of n samples, then: Look at Example 5.7
Working through some examples… • 5.19: ESP • A) ¼ = 0.25 • B) p(10)+p(11)+…+p(20) or… 1- [p(0)+…p(9)], this can be read from Table C or done in EXCEL • C) use • You would expect 5 correct choices with a standard deviation of 1.936 • D) Since the subject knows that all 5 of the shapes are on the card the choices are no longer random and hence a binomial model is not appropriate – this was not the case in parts a-c
5.21 • A) just use • B) now use: • C) • D) p = 0.01 z = 2.33, use
5.24 • Identify relevant statistics: n = 1500, p = 0.7 • A) X = np = (1500)(0.70) = 1050 • B) z = (1000-1050)/17.748, better than 99% chance • C) z = (1200-1050)/17.748, NO CHANCE!!!!! • D) X = np = 1190 and s = 18.89, chance that more than 1200 accept is now pretty good (p = 0.2892)