Download
1 / 8
80 likes | 158 Views
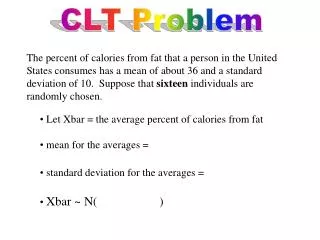
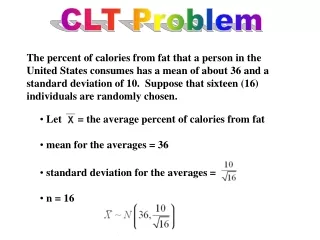
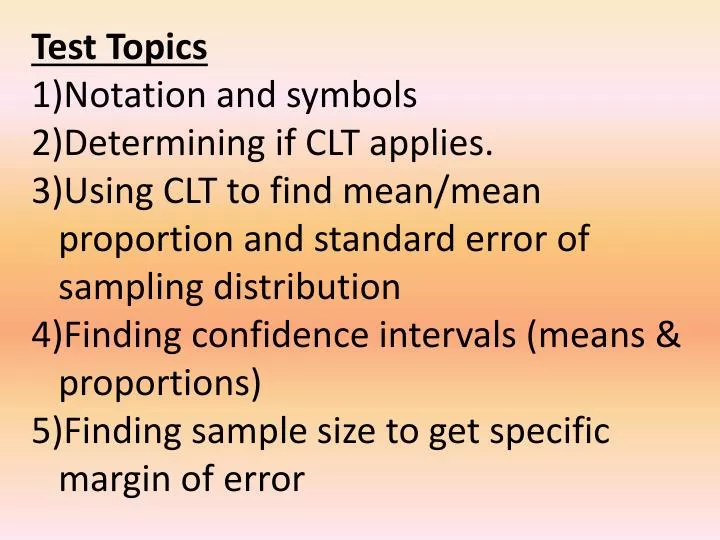
Test Topics Notation and symbols Determining if CLT applies. Using CLT to find mean/mean proportion and standard error of sampling distribution Finding confidence intervals (means & proportions) Finding sample size to get specific margin of error. CI = statistics ± z * · standard error

E N D
Test Topics Notation and symbols Determining if CLT applies. Using CLT to find mean/mean proportion and standard error of sampling distribution Finding confidence intervals (means & proportions) Finding sample size to get specific margin of error
CI = statistics ± z* · standard error margin of error What if you want the margin of error to have a certain value because you want to estimate the TRUE mean or proportion within a specific amount? Example:You want to estimate your candidates approval rating (%) within 3% of the ACTUAL approval rating across the country.
Often a high confidence level (95 or 99%), means that your interval must be very large (high margin of error). Ultimately, we would like to create a confidence interval with a high confidence level and very small margin of error. How can we control that??? Make the z* value smallerthis means a lower confidence level. Make the s value smaller this does make it easier to get a more accurate m, but is difficult to control. Make the n (sample size) larger dividing by a larger number makes the standard error smaller and in turn the margin of error smaller. Best Option!
The one part that would have the power to change the margin of error is the sample size (n). Margin of error • z* will be determined by the confidence level • or will be determined by the data • Given a certain margin of error (E), • we can solve for n.
Example: We want to estimate the average number of college games attended by all football fans per season within 2 games based upon a 95% confidence level. We know that s = 3.5 games. E Multiply by Divide by 2 Square both sides
Example: We want to estimate the average number of college games attended by all football fans per season within 2 games based upon a 95% confidence level. We know that s = 3.5 games. *We could solve the formula for “n” and use it each time we need to compute a sample size. E Multiply by Divide by E Square both sides n
Example:You want to estimate your candidate’s approval rating (%) within 3% of the ACTUAL approval rating across the country. You want to be 99% confident that your estimate is accurate and know that = 0.43. What is the minimum sample size needed to make this happen? This is a proportion. Divide by 2.575 Square both sides Multiply by n and then divide
*We could solve the formula for “n” and use it each time we need to compute a sample size. Divide by z* Square both sides Multiply by n Then divide OR )