Download
1 / 4
40 likes | 109 Views
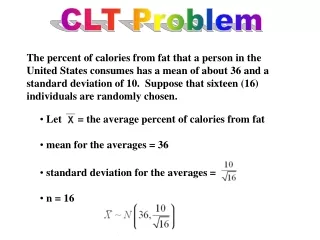
CLT Problem. The percent of calories from fat that a person in the United States consumes has a mean of about 36 and a standard deviation of 10. Suppose that sixteen individuals are randomly chosen. Let Xbar = the average percent of calories from fat mean for the averages =

E N D
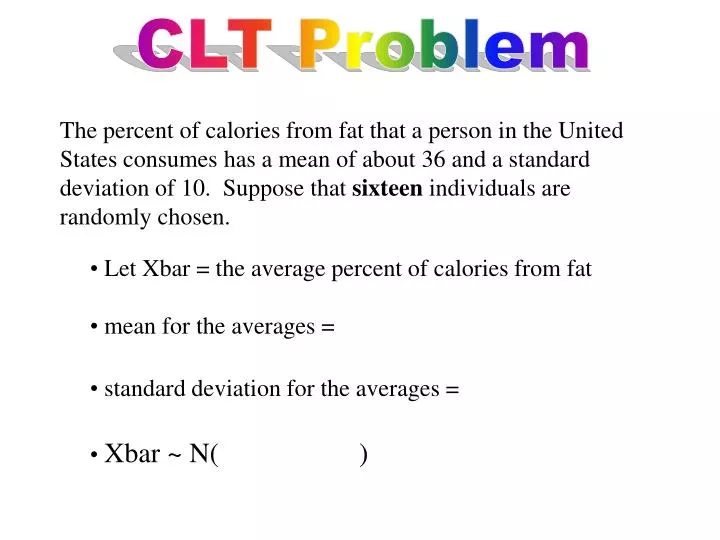
CLT Problem The percent of calories from fat that a person in the United States consumes has a mean of about 36 and a standard deviation of 10. Suppose that sixteen individuals are randomly chosen. • Let Xbar = the average percent of calories from fat • mean for the averages = • standard deviation for the averages = • Xbar ~ N( )
CLT Problem • For a group of 16 people, find the probability that the average percent of calories from fat consumed is more than 30. • Graph Probability Statement • P(Xbar > 30)
CLT Problem • Find the probability that the average percent of calories a person consumes from fat is between 30 and 40. • Graph P(30 < Xbar < 40)
CLT Problem • Find the first quartile for the average percent of calories from fat. Let k = the first quartile • Graph P(Xbar < k) = 0.25