Download
1 / 30
300 likes | 306 Views
Learn about the goals and steps of health impact assessments, as well as the potential for community involvement. Explore different types of analysis and ways to gather information. Understand the challenges of conducting an assessment.

E N D
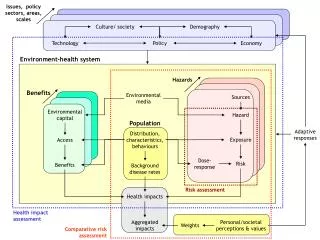
Module 4: Assessment Goals: The goals of assessment are to determine which impacts will be assessed by qualitative and quantitative analysis; to use data and research to determine the direction and magnitude of potential health impacts; and to determine if there will be differential impacts on subgroups. Health Impact Assessment for Healthy Places:A Guide for Planning and Public Health
Describe the steps in assessment and potential for community involvement Describe the different types of analysis and ways to gather information for each Determine key challenges to conducting an assessment Module 4: Objectives
Use logic framework to determine what data is needed and available Gather information using a variety of sources: Previous HIAs on similar topics Census data BRFSS, NHANES Grey literature and published literature Assess the value of the qualitative and quantitative evidence available If possible, construct quantitative models and estimate potential health effects Steps in the Assessment Process
Community stakeholders can guide field visits Participate in interviews and focus groups to provide local information or observations Help collect data to answer HIA questions Opportunities for Community Involvement
Characterize the population Determine the health status of the population Identify health risk behaviors and locations where at-risk groups may be concentrated Determine the environmental conditions Identify sources: Census, BRFSS, NHANES, local health department, hospital records, etc. Information Gathering
Qualitative – describes the direction and certainty but not magnitude of predicted results Quantitative – describes the direction and magnitude of predicted results Qualitative vs Quantitative
“not everything that can be quantified is important…..and not everything that is important can be quantified” - Jennifer Mindell, et al. 2001 (page 173)
Assess evidence pertaining to each of the links in the causal chains to health impacts Use evidence from the literature to determine direction and certainty Gather observations and local knowledge from stakeholders to apply findings to a local level Qualitative Methods
Construct quantitative models and estimate potential health effects Perform sensitivity analysis (confidence intervals) List the assumptions and limitations Quantitative Methods
When does the HIA need to be completed? How much staff time do you have and what are their qualifications? Will adding numbers have a greater impact on the decision that is made? Considerations
What is the availability and quality of the data for each health outcome? Will you need to make too many assumptions for quantitative analysis? Are baseline data available? Are there data linking the policy or project to the health outcomes? How many assumptions do you need to make for a quantitative analysis? More Considerations
Walk to School HIA: Program and Policy Elements • Comprehensive walk-to-school program includes: • Encouragement • Promotion • Education • Eliminating safety hazards • Reducing traffic congestion
Create Logic Framework Policy Proximal Intermediate Health Impacts Impacts Outcomes Education: safety training Social norms Asthma walkability Physical activity Engineering: improve pedestrian facilities, traffic calming safety Obesity Perceptions of risk (stranger danger) Air and noise pollution Enforcement: increase police presence, crossing guards Injury Motor vehicle use Dedicated resources: walking school busses
What type of analysis should be conducted? Do you have baseline data? Yes No Do you have data to predict the magnitude of change? Qualitative Analysis No Yes Determine Direction Determine Certainty Descriptive Quantitative Analysis Predictive Quantitative Analysis Recommendations Recommendations
No student has been struck by an automobile while walking or biking to school No injuries were reported in first two years of the Marin County program Orange County program reported a decrease in injury rates Injury & Walking to School
What type of analysis should be conducted? Do you have baseline data? Yes No Do you have data to predict the magnitude of change? Qualitative Analysis No Yes Determine Direction Determine Certainty Descriptive Quantitative Analysis Predictive Quantitative Analysis Recommendations Recommendations
Quantitative estimation was not feasible due to small number injuries Direction: Decrease risk for each student Certainty: Probable Traffic-related injury
Injury Recommendations • Ensure continued police enforcement of speeding laws around schools • Continue education and promotion for current and future students • Have parents available for walking school buses • Monitor and identify any future barriers on walk to school routes (construction, etc.)
The area is not a high crime area and no children have ever been abducted in this district Nationally, parents cite child safety, including “stranger abduction” as the leading reason they don’t want their children to walk to school Social capital is increased by having “eyes on the street” Risk of Abduction
What type of analysis should be conducted? Do you have baseline data? Yes No Do you have data to predict the magnitude of change? Qualitative Analysis No Yes Determine Direction Determine Certainty Descriptive Quantitative Analysis Predictive Quantitative Analysis Recommendations Recommendations
Walk-to-school programs have the potential to increase neighborhood safety through increased civic participation, social capital, and parental involvement Direction: Decrease risk Certainty: Probable Risk of Abduction & Walking to School
Increase presence of adults along walk to school routes Educate students about how to respond to strangers Educate parents about the REAL risk of stranger danger and the REAL risk of childhood inactivity and unhealthy body weight Recommendations for Risk of Abduction
Physical Activity and Obesity • High rates of overweight and at risk for overweight (24 – 45% of students) • Currently 24% of students walk to school • Program includes 6,000 elementary and middle school students • The average distance children walk to school is 0.6 miles • A program in a nearby county resulted in a 64% increase in the percentage of kids walking to school
What type of analysis should be conducted? Do you have baseline data? Yes No Do you have data to predict the magnitude of change? Qualitative Analysis No Yes Determine Direction Determine Certainty Descriptive Quantitative Analysis Predictive Quantitative Analysis Recommendations Recommendations
24% of students walk at baseline and with an expected 64% increase 39% of students are expected to walk after the intervention (.24) + (.24) (.64) (.24) + (.15) .39 With an average walking speed of 1.8 miles an hour and an average distance walked of 0.6 miles students are expected to walk for about 20 minutes 0.6 miles / (1.8miles / 1 hour) = 0.33 hours 0.33 hours = 20 minutes Risk Assessment: Expected Outcomes on Physical Activity
Walk to school programs in one school district will have same effect in another school district 1 year time horizon for effects Average distance walked to school is 0.6 miles (NHTS, 2001) Average walking speed is 1.8 mph Assumptions for Kids Walking
Walk to school programs only provide a part of the daily recommended physical activity for children (1 hour per day) so encourage children to be active after school, have enhanced PE classes daily at school, and daily recess Children who are bused or driven need drop off zones so they at least get some physical activity Recommendations for Physical Activity
Finding baseline data and an effect estimate Finding information for subpopulations Having personnel with the time and ability to conduct the analysis Dealing with uncertainties (data, models, policy) Working within a specific time frame Ensuring relevance to stakeholders and decision makers Challenges to Assessment