Download
1 / 35
370 likes | 507 Views
CO 2 Mobility Control in Carbonate Cores. Consortium Meeting Apr. 29 th 2013 Presented by Leyu Cui Kun Ma, Ramesh Pudasaini, Maura Puerto and George Hirasaki Sponsored by ADNOC and DOE. Outline. Setup Diagrams Surfactants and Cores C12/DI and CO 2 foam C12/Brine and CO 2 foam

E N D
CO2 Mobility Control in Carbonate Cores Consortium Meeting Apr. 29th 2013 Presented by Leyu Cui Kun Ma, Ramesh Pudasaini, Maura Puerto and George Hirasaki Sponsored by ADNOC and DOE
Outline • Setup Diagrams • Surfactants and Cores • C12/DI and CO2 foam • C12/Brine and CO2 foam • Conclusion
Outline • Setup Diagrams • Surfactants and Cores • C12/DI and CO2 foam • C12/Brine and CO2 foam • Conclusion
Diagram of the high temperature and high pressure core flooding setup All wetting materials are Hastelloy Alloys, which can work under high P, T, salinity and low pH. Pumps System
Carbon Dioxide: Pressure-Enthalpy Diagram 3400 psi, 82 ˚C (180 ˚F) Joule-Thomson Expansion Isobaric Heating 1200 psi, 35 ˚C 1200 psi, 82 ˚C Joule-Thomson Expansion 14 .5psi, 15 ˚C *Good plant design and operation for onshore carbon capture installations and onshore pipelines, Energy Institute, 2010 09,
Outline • Setup Diagrams • Surfactants and Cores • C12/DI and CO2 foam • C12/Brine and CO2 foam • Conclusion
Surfactant and Brine • C12: ethoxylated amine from AKZO NOBEL Co. is dissolved in DI water. C12’s molecular weight is 288 g/mol. R = Coco group (≈ 8 to 16 carbon) x + y=2 • Brine: 22% TDS (total disolved solids) withhighdivalentions (Ca2+, Mg2+) concentrations.
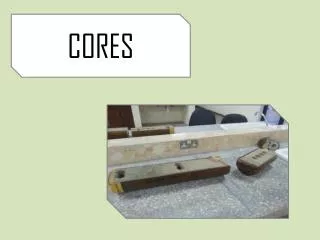
Silurian Dolomite Core • Diameter=1.5 in. • Length= 7.6 cm= 2.99 in. • Permeability is 737 md, measured by water
Outline • Setup Diagrams • Surfactants and Cores • C12/DI and CO2 foam • C12/Brine and CO2 foam • Conclusion
Injection Procedure: a slug of CO2 is injected before C12 WAG is injected to acidify the core to pH <4 before C12 and CO2 co-injection. Both WAG and Co-injection have the same foam quality. 1% C12 in DI Water pH is adjusted by acetic acid pH of water equilibrium with Dolomite
C12 Plug the Core without CO2 C12/DI is saturated with CO2 under 1 atm. The pH is decreased to 5 to dissolved C12 in water at room temperature.
Normalized Pressure Gradient: Apparent Viscosity • Apparent viscosity is used to describe the foam strength, which is calculated by Darcy’s law: where is foam apparent viscosity, is core permeability, is the total superficial velocity and is the pressure gradient.
C12/DI and CO2 Foam Pressure History at 20 °C and 3400 psi 50% Foam Quality 30% Foam Quality µ*=118.30 cp µ*=78.91 cp 70% Foam Quality 80% Foam Quality µ*=65.72 cp µ*=139.98 cp
Experimental Data vs. Foam Model for C12/DI and CO2 foam krw0=0.5; krg0=0.1768; S_wc=0.33; S_gr=0.2; nw=2.8; ng=1.1; (Bennion, 2008) µw=1 cp; µg=0.1025 cp; epdry=200; fmmob=340.99; fmdry=0.39; (Rossen, W. R. and Renkema, W. J. (2007); Ma, K., Lopez-Salinas, J.L and et al., Energy & Fuels (in press).)
Outline • Setup Diagrams • Surfactants and Cores • C12/DI and CO2 foam • C12/Brine and CO2 foam • Conclusion
C12/Brine and CO2 Foam Pressure History at 20 °C and 3400 psi 30% Foam Quality 50% Foam Quality 70% Foam Quality 80% Foam Quality
Salt may precipitate at high foam quality 90% Foam Quality 90% Foam Quality Average apparent viscosity NadjaMullera, Ran Qib, and et al., CO2 injection impairment due to halite precipitation, Energy Procedia, Volume 1, Issue 1, 2009 S. Hurter, D. Labregere, and J. Berge, Simulations for CO2 injection projects with Compositional Simulator, SPE 108540, 2007
Experimental data vs. Foam model for C12/Brine and CO2 foam krw0=0.5; krg0=0.1768; S_wc=0.33; S_gr=0.2; nw=2.8; ng=1.1; (Bennion, 2008) µw=1 cp; µg=0.1025 cp; epdry=10000; fmmob= 549.35; fmdry= 0.37; (Rossen, W. R. and Renkema, W. J. (2007). )
C12/Brine and CO2 Foam at 120 °C and 3400 psi µ*=59.14 cp 60% Foam Quality
Comparison of viscosity at 20 and 120 °C for C12/Brine and CO2 Foam krw0=0.5; krg0=0.1768; S_wc=0.33; S_gr=0.2; nw=2.8; ng=1.1; (Bennion, 2008) µw=0.2381 cp; µg=3.935×10⁻²cp; epdry=10000
Conclusion • The cloud point of C12 is lower than room temperature at pH>9. A slug of CO2 should be injected before C12 solution in carbonate reservoir. • C12 can generate strong foam in a wide range of foam quality. But foam generation is delayed at high foam quality, because the surfactant solution is diluted by residual water. • The foam is stronger in brine than in DI water for C12 and CO2 foam. The foam strength is reduced at elevated temperature. • The local equilibrium model can fit our experimental data. But this foam model doesn’t include capillary force, solubility factor, et al. which probably caused the difference between the experimental data and calculation result.
Questions? • Thank you!
Close to connate water saturation (Swc) at high foam quality
ESEM photograph of Berea sandstone after 32 hrs of CO2 flooding. Red arrows point at Hopper NaCl crystals. (NadjaMullera, Ran Qib, and et al., CO2 injection impairment due to halite precipitation, Energy Procedia, Volume 1, Issue 1, 2009)
Water evaporation to CO2 N. Spycher, K Pruess, J Ennis-King, CO2- H2O mixtures in the geological sequestration of CO2. I. Assessment and calculation of mutual solubilities from 12 to 100C and up to 600 bar, Geochimica et CosmochimicaActa, 67 (16) (2003), pp. 3015–3031 yH2O: mole fraction of H2O in CO2 phase. 0.38% at 20 ˚C and 234 bar. Convert to volumetric fraction=0.15% . TDS increase from 22% to (22%*0.1)/(0.1-0.9*0.15%)=22.3% for 90% foam quality. The increase of total TDS is negligible. But the local CO2 concentration is probably high and results in the high water evaporation.
Injection Strategy: start at high flow rate to reach the MPG