Download
1 / 1
10 likes | 109 Views
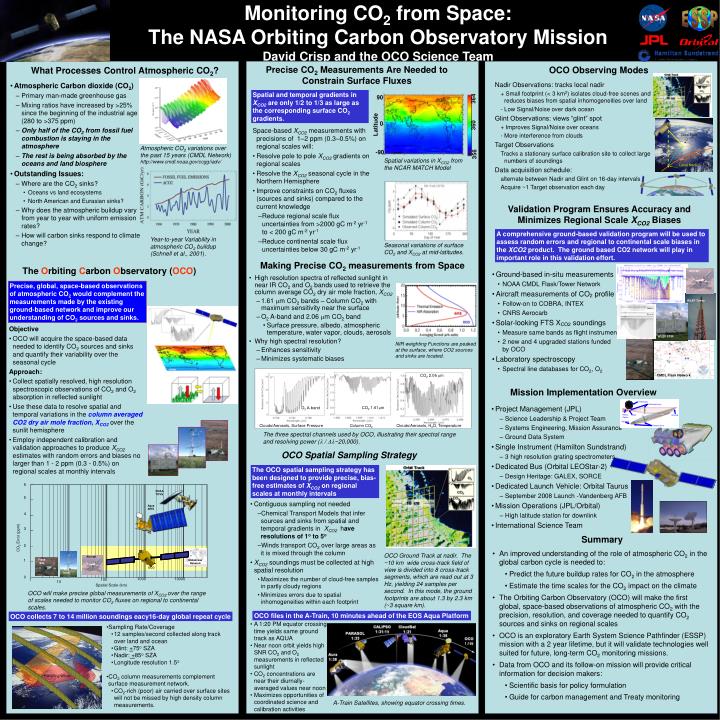
Monitoring CO 2 from Space: The NASA Orbiting Carbon Observatory Mission David Crisp and the OCO Science Team. ESSP. Glint Spot. Ground Track. Local Nadir. Prevailing Winds. 90. 364. 0. Latitude. 360. -90. 356. Telescope. Telescope. Collimator lens. Collimator lens. Relay.

E N D
Monitoring CO2 from Space: The NASA Orbiting Carbon Observatory Mission David Crisp and the OCO Science Team ESSP Glint Spot Ground Track Local Nadir Prevailing Winds 90 364 0 Latitude 360 -90 356 Telescope Telescope Collimator lens Collimator lens Relay Relay Slit Slit Grating Grating Optics Optics Detector Detector Camera lens Camera lens CO2 2.06 m CO2 1.61m O2 A-band Clouds/Aerosols, Surface Pressure Column CO2 Clouds/Aerosols, H2O, Temperature 1:18 OCO Observing Modes What Processes Control Atmospheric CO2? Precise CO2 Measurements Are Needed to Constrain Surface Fluxes • Space-based XCO2 measurements with precisions of 1–2 ppm (0.3–0.5%) on regional scales will: • Resolve pole to pole XCO2 gradients on regional scales • Resolve the XCO2 seasonal cycle in the Northern Hemisphere • Improve constraints on CO2 fluxes (sources and sinks) compared to the current knowledge • Reduce regional scale flux uncertainties from >2000 gC m-2 yr-1 to < 200 gC m-2 yr-1 • Reduce continental scale flux uncertainties below 30 gC m-2 yr-1 • Nadir Observations: tracks local nadir • + Small footprint (< 3 km2) isolates cloud-free scenes and reduces biases from spatial inhomogeneities over land • Low Signal/Noise over dark ocean • Glint Observations: views “glint” spot • + Improves Signal/Noise over oceans • More interference from clouds • Target Observations • Tracks a stationary surface calibration site to collect large numbers of soundings • Data acquisition schedule: • alternate between Nadir and Glint on 16-day intervals • Acquire ~1 Target observation each day • Atmospheric Carbon dioxide (CO2) • Primary man-made greenhouse gas • Mixing ratios have increased by >25% since the beginning of the industrial age (280 to >375 ppm) • Only half of the CO2 from fossil fuel combustion is staying in the atmosphere • The rest is being absorbed by the oceans and land biosphere • Outstanding Issues: • Where are the CO2 sinks? • Oceans vs land ecosystems • North American and Eurasian sinks? • Why does the atmospheric buildup vary from year to year with uniform emission rates? • How will carbon sinks respond to climate change? Spatial and temporal gradients in XCO2 are only 1/2 to 1/3 as large as the corresponding surface CO2 gradients. Atmospheric CO2 variations over the past 15 years (CMDL Network) http://www.cmdl.noaa.gov/ccgg/iadv/ Spatial variations in XCO2 from the NCAR MATCH Model Validation Program Ensures Accuracy and Minimizes Regional Scale XCO2 Biases A comprehensive ground-based validation program will be used to assess random errors and regional to continental scale biases in the XCO2 product. The ground based CO2 network will play in important role in this validation effort. Year-to-year Variability in atmospheric CO2 buildup (Schnell et al., 2001). Seasonal variations of surface CO2 and XCO2 at mid-latitudes. Making Precise CO2 measurements from Space The Orbiting Carbon Observatory (OCO) Aircraft • Ground-based in-situ measurements • NOAA CMDL Flask/Tower Network • Aircraft measurements of CO2 profile • Follow-on to COBRA, INTEX • CNRS Aerocarb • Solar-looking FTS XCO2 soundings • Measure same bands as flight instrument • 2 new and 4 upgraded stations funded by OCO • Laboratory spectroscopy • Spectral line databases for CO2, O2 • High resolution spectra of reflected sunlight in near IR CO2 and O2 bands used to retrieve the column average CO2 dry air mole fraction, XCO2 • 1.61 m CO2 bands – Column CO2 with maximum sensitivity near the surface • O2 A-band and 2.06 m CO2 band • Surface pressure, albedo, atmospheric temperature, water vapor, clouds, aerosols • Why high spectral resolution? • Enhances sensitivity • Minimizes systematic biases Precise, global, space-based observations of atmospheric CO2 would complement the measurements made by the existing ground-based network and improve our understanding of CO2 sources and sinks. WLEF Tower • Objective • OCO will acquire the space-based data needed to identify CO2 sources and sinks and quantify their variability over the seasonal cycle • Approach: • Collect spatially resolved, high resolution spectroscopic observations of CO2 and O2 absorption in reflected sunlight • Use these data to resolve spatial and temporal variations in the column averaged CO2 dry air mole fraction,XCO2over the sunlit hemisphere • Employ independent calibration and validation approaches to produce XCO2 estimates with random errors and biases no larger than 1 - 2 ppm (0.3 - 0.5%) on regional scales at monthly intervals WLEF FTIR NIR weighting Functions are peaked at the surface, where CO2 sources and sinks are located. CMDL Flask Network Mission Implementation Overview • Project Management (JPL) • Science Leadership & Project Team • Systems Engineering, Mission Assurance • Ground Data System • Single Instrument (Hamilton Sundstrand) • 3 high resolution grating spectrometers • Dedicated Bus (Orbital LEOStar-2) • Design Heritage: GALEX, SORCE • Dedicated Launch Vehicle: Orbital Taurus • September 2008 Launch -Vandenberg AFB • Mission Operations (JPL/Orbital) • High latitude station for downlink • International Science Team The three spectral channels used by OCO, illustrating their spectral range and resolving power ( / ~20,000). OCO Spatial Sampling Strategy The OCO spatial sampling strategy has been designed to provide precise, bias-free estimates of XCO2 on regional scales at monthly intervals 6 NOAA TOVS 5 • Contiguous sampling not needed • Chemical Transport Models that infer sources and sinks from spatial and temporal gradients in XCO2 have resolutions of 1o to 5o • Winds transport CO2 over large areas as it is mixed through the column • XCO2 soundings must be collected at high spatial resolution • Maximizes the number of cloud-free samples in partly cloudy regions • Minimizes errors due to spatial inhomogeneities within each footprint Aqua AIRS 4 3 Summary CO2 Error (ppm) 2 • An improved understanding of the role of atmospheric CO2 in the global carbon cycle is needed to: • Predict the future buildup rates for CO2 in the atmosphere • Estimate the time scales for the CO2 impact on the climate • The Orbiting Carbon Observatory (OCO) will make the first global, space-based observations of atmospheric CO2 with the precision, resolution, and coverage needed to quantify CO2 sources and sinks on regional scales • OCO is an exploratory Earth System Science Pathfinder (ESSP) missionwith a 2 year lifetime, but it will validate technologies well suited for future, long-term CO2 monitoring missions. • Data from OCO and its follow-on mission will provide critical information for decision makers: • Scientific basis for policy formulation • Guide for carbon management and Treaty monitoring OCO Ground Track at nadir. The ~10 km wide cross-track field of view is divided into 8 cross-track segments, which are read out at 3 Hz, yielding 24 samples per second. In this mode, the ground footprints are about 1.3 by 2.3 km (~3 square km). Aircraft 1 Flask Site Globalview Network OCO Flux Tower 0 1000 10000 1 100 10 Spatial Scale (km) OCO will make precise global measurements of XCO2 over the range of scales needed to monitor CO2 fluxes on regional to continental scales. OCO files in the A-Train, 10 minutes ahead of the EOS Aqua Platform OCO collects 7 to 14 million soundings eacy16-day global repeat cycle • A 1:20 PM equator crossing time yields same ground track as AQUA • Near noon orbit yields high SNR CO2 and O2 measurements in reflected sunlight • CO2 concentrations are near their diurnally-averaged values near noon • Maximizes opportunities of coordinated science and calibration activities • Sampling Rate/Coverage • 12 samples/second collected along track over land and ocean • Glint: +75o SZA • Nadir: +85o SZA • Longitude resolution 1.5o • CO2 column measurements complement surface measurement network. • CO2-rich (poor) air carried over surface sites will not be missed by high density column measurements. A-Train Satellites, showing equator crossing times.