Download
1 / 20
210 likes | 336 Views
Geobiology Group. www.geol.vt.edu/paleo. A Comparative Analysis of Time Averaging for Bivalves and Brachiopods from a Modern Tropical Shelf. R.A. Krause Jr. 1 , S.L. Barbour Wood 1 , J.F. Wehmiller 2 , M. Kowalewski 1 , M.G. Sim ões 3. 1 Virginia Tech, Dept. of Geosciences, Blacksburg, VA

E N D
Geobiology Group www.geol.vt.edu/paleo A Comparative Analysis of Time Averaging for Bivalves and Brachiopods from a Modern Tropical Shelf R.A. Krause Jr.1, S.L. Barbour Wood1, J.F. Wehmiller2, M. Kowalewski1, M.G. Simões3 1 Virginia Tech, Dept. of Geosciences, Blacksburg, VA 2 Univ. of Delaware, Earth Sciences, Newark, DE 3Universidade Estadual Paulista, Instituto de Biociências, Sao Paulo, Brazil
Funding • NSF Geology & Paleontology (MK & JFW) • ACS-Petroleum Research Fund (MK) • David R. Wones Geoscience Scholarship, Dept. of Geosciences, Virginia Tech (RAK) • Graduate Research Development Grant, Virginia Tech (RAK)
Introduction • Time averaging = Temporal mixing • Duration of temporal mixing determines resolution • Quantitative estimates of time averaging are increasingly available, although studies are biased toward mollusks Importance • First study to investigate duration of time averaging on two very different shelled invertebrates from the same environment • Allows more accurate interpretation of polytypic shell beds
Outline • Age-Frequency Distributions (AFD): • Comparison of scale of time averaging • Are there differences between brachiopods and bivalves? • Analysis of Completeness: • How complete is the record for each taxon? • With 100% completeness, what would AFD look like?
Brachiopods Bivalves Totals 10 m 30 28 58 30 m 36 36 72 66 64 130 10 m 30 m Locality & Methods • Shells dredged from two offshore sites (10m, 30m) • Dated using amino acid racemization • D/L ratios calibrated with AMS radiocarbon dates • Comparison of Age-frequency distributions • Analysis of completeness of each sample
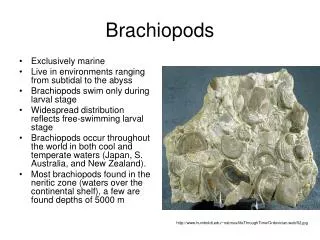
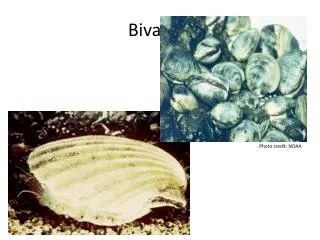
Bouchardia rosea Semele casali 10 cm Physical Characteristics Semele casali - thin shell - low organic content - aragonitic *infaunal life habit Bouchardia rosea - robust shell - high organic content - calcitic *epifaunal life habit
Bivalves 0.12 r2=0.73 Brachiopods 0.1 0.4 0.08 r2= 0.96 0.3 (D/L Aspartic)2 0.06 (D/L Aspartic)2 0.04 0.2 0.02 0.1 0 0 1000 2000 3000 0 Age (Years BP) 0 2000 4000 6000 Age (Years BP) Amino Acid Racemization Dating • Ratio of 'D' to 'L' form of aspartic acid predicts well age of shell • Ratios of many shells can be calculated for the cost of one radiocarbon date • D/L aspartic acid ratio determined with gas chromatography • Calibrated with 19 AMS radiocarbon dates
Age-Frequency Distributions 35 30 25 20 Frequency 15 10 5 0 2000 3000 1000 4000 7000 8000 5000 6000 Pooled Distribution For Bivalves and Brachiopods n=130 range=8438 median=985.5 SD=2246 g1=1.12 g2=0.17 Age (years BP)
Age-Frequency Distributions 10 8 6 4 2 0 8 6 4 2 0 4 2 0 16 14 12 10 8 6 4 2 0 8000 2000 5000 6000 4000 3000 1000 7000 n=30 range=4660 yrs median=661 yrs SD=1400 yrs Brachiopods: 10 m n=36 range=6192 yrs median=775 yrs SD=1542 yrs Bivalves: 30 m Frequency Brachiopods: 30 m n=28 range=7725 yrs median=4003 yrs SD=2548 yrs Bivalves: 10 m n=36 range=8438 yrs median=738 yrs SD=2417 yrs Age (years BP)
Wilcoxon Two-Sample Test Between-taxa comparisons of central tendency α=0.05 10 m 30 m Kolmogorov-Smirnov Test Between-taxa comparisons of distribution shape α=0.05 10 m 30 m Z=-0.26 p=0.79 D=0.22 p=0.43 Z=4.0 p<0.001 D=0.5 p<0.001 Wilcoxon Two-Sample Test Between-site comparisons of central tendency α=0.05 Brachiopods Bivalves Kolmogorov-Smirnov Test Between-site comparisons of distribution shape α=0.05 Brachiopods Bivalves Z=4.12 p<0.001 D=0.48 p<0.001 Z=0.08 p=0.94 D=0.25 p=0.21 Distribution Comparisons
Scale of Time Averaging • Dispersion metrics • Range: sensitive to sample size • Shell half-life: assumes continuous input of shells • Standard deviation: less sensitive to sample size, no restrictive assumptions • Confidence intervals around SD • estimated using independent 1000 iter. bootstrap simulations • 95% and 99% confidence intervals calculated from 0.5, 2.5, 97.5, and 99.5 percentiles of sampling distribution
4 2 0 16 3000 14 12 10 2000 Years 8 6 4 1000 2 Brachiopods 0 Bivalves 8 0 6 30 m 10 m 30 m 10 m 4 2 0 10 8 6 4 2 0 Confidence Intervals for SD Brachiopods: 10 m Brachiopods: 30 m Bivalves: 30 m Bivalves: 10 m
Bahía la Choya Gulf of California: intertidal, low sed. Inner tidal flat Tidal channel 10 m Bahía Concepcíon Gulf of California: shallow, high sed. core Colorado River Delta: beach ridges core 16 m fan deltas pocket bays 10 m 23 m Meldahl et al., 1997 Flessa et al., 1993 Kowalewski et al., 1998 6 m Comparison With Other Studies 10000 shelf Brachiopods Bivalves 9000 inactive beach ridges 8000 nearshore 7000 6000 fossil assemblages 5000 Ubatuba Bay, Brazil: mixed carbonate- siliciclastic shelf 4000 Flessa & Kowalewski, 1994 3000 Standard Deviation of Shell Age 2000 1000 30 m 0 This Study Carroll et al., 2003 *95% & 99% confidence intervals calculated by bootstrapping
# of time intervals with paleontological record Completeness (%) = X 100 # of time intervals Temporal Completeness • Completeness is scale-dependant • decreases with increasing resolution and/or range • increases with increasing sample size, generally speaking • High incompleteness suggests discontinuous time averaging • However, most distributions have gaps due to sampling • With 100% complete fossil record, how likely is it to get samples as complete as ours?
Uniform Distribution Frequency Years Years Exponential Distribution Frequency Completeness Simulations Monte Carlo Simulations: Randomly sample 100% complete distributions • Uniform Distribution: Provides conservative incompleteness estimates • Exponential Distribution: More realistic distribution
Uniform Distribution Frequency Years Years Exponential Distribution Frequency Completeness Simulations Monte Carlo Simulations: Randomly sample 100% complete distributions sample size k;observed age range r; resolution b - 1000 iterations - draw k observations from each distribution with range r - calculate expected completeness for each sample at a resolution of b
4 2 Uniform Distribution 0 Frequency Years 40 Exponential Distribution uniform 30 actual completeness Frequency % completeness exponential 20 Years 10 0 Completeness Simulations Brachiopods: 30 m Actual Completeness:26.9% Expected Completeness: • Uniform Distribution: 30.7% • Exponential Distribution: 19% 95% probability that sample was drawn from uniform age-frequency distribution
60 50 40 % completeness 30 20 10 uniform distribution exponential distribution 0 Bivalves 10m Bivalves 30m Brachiopods 10m Brachiopods 30m Summary of Simulations Brachiopods: Samples are statistically indistinguishable from those drawn from a 100% complete, uniform distribution Bivalves: 30 m sample is significantly different from uniform and exponential distribution. 10 m sample is statistically indistinguishable from those drawn from a 100% complete, exponential distribution
Interpretation • Simulations suggest different underlying distribution for brachiopods and bivalves • At least two possible explanations • Different rate of destruction: • uniform distribution = low destruction rate • caused by differing physical characteristics • Different input rate: • bivalves input at constant rate • brachiopods input in pulses • possibly due to fluctuations in upwelling location and intensity
10 8 8 6 6 4 4 2 2 0 0 Conclusions Scale of Time Averaging - Brachiopods and Bivalves similar within closely related sites - Environment and Burial History may be most important - Suggests that polytypic shell beds may have similar time averaging durations for each taxon Completeness - Brachiopod record may be 100% complete and uniform - Bivalve record may be 100% complete, but not uniform - Difference in underlying distribution could reflect ecology, taphonomy, or both