Download
1 / 17
170 likes | 292 Views
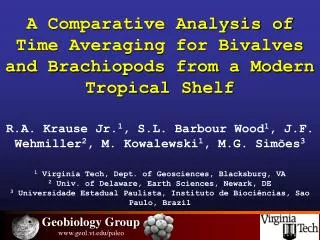
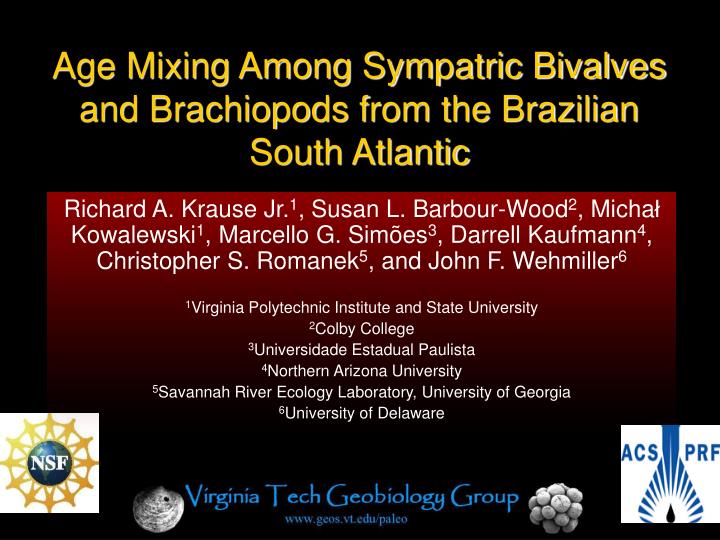
Age Mixing Among Sympatric Bivalves and Brachiopods from the Brazilian South Atlantic. Richard A. Krause Jr. 1 , Susan L. Barbour-Wood 2 , Micha ł Kowalewski 1 , Marcello G. Simões 3 , Darrell Kaufmann 4 , Christopher S. Romanek 5 , and John F. Wehmiller 6

E N D
Age Mixing Among Sympatric Bivalves and Brachiopods from the Brazilian South Atlantic Richard A. Krause Jr.1, Susan L. Barbour-Wood2, Michał Kowalewski1, Marcello G. Simões3, Darrell Kaufmann4, Christopher S. Romanek5, and John F. Wehmiller6 1Virginia Polytechnic Institute and State University 2Colby College 3Universidade Estadual Paulista 4Northern Arizona University 5Savannah River Ecology Laboratory, University of Georgia 6University of Delaware
Introduction How does time averaging compare among two very different organisms collected from the same environment? Part 1: Comparisons of age-frequency distributions among brachiopods and bivalves Part 2: Investigation of the relationship between depth and time averaging duration
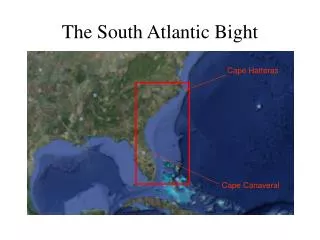
Locality & Methods Grain size distribution by site 60 Site 1: 30 m 50 Site 9: 10 m • Shells dredged from two offshore sites (10m, 30m) • Each site is similar in sedimentological and other physical characteristics 40 Weight Percent 30 20 10 0 Mud (%) Gravel (%) Fine sand (%) Coarse sand (%) Medium sand (%) Very fine sand (%) Very coarse sand (%) 10 m 30 m *Mean annual measurements Barbour Wood et al. (2006) Quaternary Research
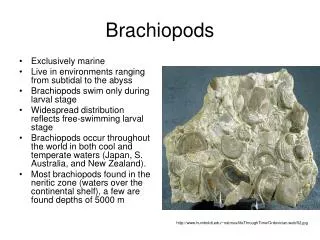
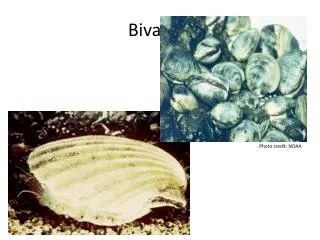
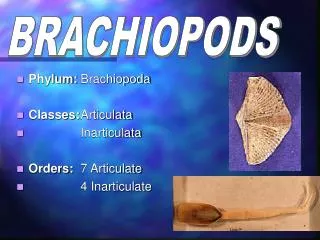
Physical Characteristics Bouchardia rosea Semele casali 10 mm Semele casali - thin shell - low organic content - aragonitic *infaunal life habit Bouchardia rosea - robust shell - high organic content - calcitic *epifaunal life habit
Amino Acid Racemization Dating • 178 shells dated in this study • D/L aspartic acid ratios calculated in several replicates for each shell • Calibrated with 19 AMS radiocarbon dates Samples taken from hinge area to minimize intrashell variability (Brigham, 1983; Carroll et al., 2003)
Age Calibration Adj. r2 = 0.970 p = 0.0014 Brachiopods 10 m 0.200 5 14C dated shells (D/L Asp2.7) 0.100 0.000 0 2 4 6 Calibrated kyrs 0.200 Adj. r2 = 0.915 p = 0.0287 Brachiopods 30 m 4 14C dated shells (D/L Asp2.7) 0.100 0.000 0 2 4 6 8 Calibrated kyrs Adj. r2 = 0.971 p = 0.0096 Bivalves 10 m 0.020 4 14C dated shells (D/L Asp2.7) 0.010 0.000 0 1 2 3 Calibrated kyrs 0.040 Adj. r2 = 0.978 p = 0.0001 Bivalves 30 m 0.030 6 14C dated shells (D/L Asp2.7) 0.020 0.010 0.000 0 1 2 3 Calibrated kyrs Barbour Wood et al. (2006) Quaternary Research
Age-Frequency Distribution Comparisons 0 0 1 1 2 2 3 3 4 4 5 5 6 6 7 7 8 8 9 9 10 10 25 Brachiopods, n=103 20 Frequency 15 10 5 Wilcoxon two-sample test Z=-1.89, p=0.0582 Kolmogorov-Smirnov test D=0.186, p=0.0996 0 Age (kyrs) 20 Bivalves, n=75 15 Frequency 10 5 0 Age (kyrs)
Age-Frequency Distribution Comparisons 0 0 1 1 2 2 3 3 4 4 5 5 6 6 7 7 8 8 9 9 10 10 5 30 m site, n=69 Frequency Wilcoxon two-sample test Z=5.04, p<0.0001 Kolmogorov-Smirnov test D=0.409, p<0.0001 0 Age (kyrs) 35 10 m site, n=109 30 25 20 Frequency 15 10 5 0 Age (kyrs)
Age-Frequency Distribution Comparisons 0 0 1 1 2 2 3 3 4 4 5 5 6 6 7 7 8 8 9 9 10 10 20 Brachiopods, between-sites Wilcoxon two-sample test Z=5.49, p<0.0001 Kolmogorov-Smirnov test D=0.625, p<0.0001 Brachiopods 10 m n = 71 15 10 Frequency 5 30m site, between-species Wilcoxon two-sample test Z=4.21, p<0.0001 Kolmogorov-Smirnov test D=0.625, p<0.0001 0 5 Brachiopods 30m, n = 32 0 Age (kyrs) 20 Bivalves 10 m n = 38 Bivalves, between-sites Wilcoxon two-sample test Z=2.38, p=0.017 Kolmogorov-Smirnov test D=0.472, p=0.0005 15 10 Frequency 5 10m site, between-species Wilcoxon two-sample test Z=-1.04, p=0.300 Kolmogorov-Smirnov test D=0.188, p=0.344 0 5 Bivalves 30 m n = 37 0 Age (kyrs)
Summary of the Data Brachiopods 10m (n=71) Brachiopods 30m (n=32) Bivalves 10m (n=38) Bivalves 30m (n=37) 10m site (n=109) 30m site (n=69) Bivalves (n=75) Brachiopods (103) 0 1 2 3 4 0 1 2 3 4 95% Confidence intervals from separate 5000 (SQR) and 1000 (SD) iteration bootstrap simulations. Semi-Quartile Range (kyrs) Standard Deviation (kyrs) • Brachiopods and bivalves exhibit similar duration of time averaging when sites are pooled • - Site-to-site variation can impose significant differences, even in the same oceanographic province
40 40 30 30 20 20 10 10 0 0 1 2 3 4 5 6 0 1 2 3 4 0 40 30 20 10 0 1 2 3 4 0 Exploring the Relationship Between Time Averaging Magnitude and Depth Standard Deviation (SD) n = 21 Mean n = 21 Semi-quartile Range (SQR) n = 21 Depth (m) kyrs kyrs kyrs An increase in time averaging duration with increasing depth? Possible Factors: sea level history; sedimentation rate; many others... Meta-analysis restricted to siliciclastic-dominated inner-shelf settings, but a variety of depositional systems and oceanographic settings were included Meta-analysis data sources: • Bahia la Choya, Gulf of California, Mexico (Flessa et al. 1993) • Bahia Concepcion, Gulf of California, Mexico (Meldahl et al. 1997) • Colorado Delta, Gulf of California, Mexico (Kowalewski et al. 1998) • Ubatuba Bay, Brazil (Carroll et al. 2003; This study) • Caribbean Coast of Panama (Kidwell et al. 2005)
40 40 30 30 20 20 10 10 0 0 1 2 3 4 5 6 0 1 2 3 4 0 40 Depth Depth Depth Depth 30 20 Age Age Age Age 10 0 1 2 3 4 0 Exploring the Relationship Between Time Averaging Magnitude and Depth Standard Deviation (SD) n = 21 Mean n = 21 Semi-quartile Range (SQR) n = 21 Depth (m) kyrs kyrs kyrs Null Models Indirect Relationships Direct Relationships Logarithmic Linear Directional Trend Passive Trend
Determination of adequate sample size using regression 1 1 Mean Mean p Adj. r2 0.1 0.5 0.01 0 0 10 20 30 40 0 10 20 30 40 1 SD 1 SD Preferred Threshold Sample Size = 4 0.5 p Adj. r2 0.1 0 -0.5 0.01 -1 0 10 20 30 40 0 10 20 30 40 1 1 SQR SQR 0.5 Adj. r2 p 0.1 0 0.01 -0.5 0 10 20 30 40 0 10 20 30 40 Threshold sample size Threshold sample size
40 40 40 30 30 30 20 20 20 10 10 10 0 0 0 1 2 3 4 0 1 2 3 4 5 6 0 1 2 3 4 0 Depth Depth Age Age Direct Relationships Standard Deviation (SD) n = 14 Mean n = 14 Semi-quartile Range (SQR) n = 14 Depth (m) Age (kyrs) Age (kyrs) Age (kyrs) Linear Mean SD SQR Adj. r2 = 0.326 p = 0.019 Adj. r2 = 0.245 p = 0.041 Adj. r2 = 0.332 p = 0.018 Logarithmic Mean SD SQR Adj. r2 = 0.296 p = 0.026 Adj. r2 = 0.159 p = 0.088* Adj. r2 = 0.373 p = 0.016
40 40 40 30 30 30 20 20 20 10 10 10 0 0 0 1 2 3 4 0 1 2 3 4 5 6 0 1 2 3 4 0 Depth Depth Age Age Indirect Relationships Standard Deviation (SD) n = 14 Mean n = 14 Semi-quartile Range (SQR) n = 14 Depth (m) Age (kyrs) Age (kyrs) Age (kyrs) More difficult to test for these models More data are needed from a variety of environments Directional Trend Passive Trend
Conclusions: Part 1 • Brachiopod and bivalve age-frequency distributions vary between sites • No clear trend in differences between sites: indicates stochastic variation in taphonomic processes • When pooled, brachiopods and bivalves have very similar duration of time averaging • Biological properties (shell mineralogy, life habit etc.) may not be as important as the frequency and intensity of taphonomic processes in determining time averaging duration for these two groups
Conclusions: Part 2 • For pooled data, there is a suggestion of a relationship between time averaging duration and depth • Time averaging duration generally increases with depth • This putative relationship holds for bivalves and brachiopods • Relationship may be direct or indirect, more data is needed