Download
1 / 26
260 likes | 362 Views
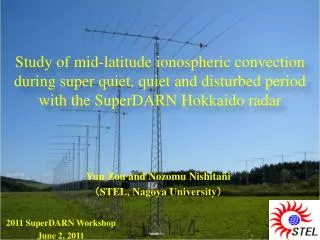
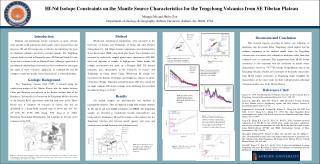
Heat and Particle Transport Investigation in Tore Supra with SMBI. Xiaolan ZOU. CEA, IRFM, F-13108 Saint-Paul-Lez-Durance, France. SMBI Experiments. SMBI experiments setup: Modulation frequency: 1 Hz; Density: n e : 1.3~3.0x10 19 m -3

E N D
Heat and Particle Transport Investigation in Tore Supra with SMBI Xiaolan ZOU CEA, IRFM, F-13108 Saint-Paul-Lez-Durance, France Xiaolan Zou
SMBI Experiments • SMBI experiments setup: Modulation frequency: 1 Hz; • Density: ne: 1.3~3.0x10¹⁹m-3 • “non-local” transport: Central heating driven by edge cooling (CHEC) Previous Observations Gentle, TEXT, Impurity, 1995 Kissick, TFTR, Impurity, 1995 Zou, Tore Supra, Pellet 1998 Mantica, RTP, Pellet, 2000 Fig.1 SMBI modulation experiment with ECRH. Xiaolan Zou
SMBI Experiments • Threshold in density : 2.2x10¹⁹m-3 withou CHEC with CHEC Fig.2 Diagram for the observation of CHEC. Xiaolan Zou
Temperature Profile • Temperature profile comparison between three phases • before injection • after injection and with ‘nonlocal’ effect • after ‘nonlocal’ phenomena disappear. Fig. 3 Temperature profile variation and perturbation evolution with nonlocal effect. Xiaolan Zou
Hot pulse SMBI SMBI Cold pulse Fig.4 Time-space evolution of the temperature perturbation during SMBI with CHEC. Fig.5 Time-space evolution of the temperature perturbation during SMBI without CHEC. Cold pulse Diffusion Convection Damping Source Cold Pulse Propagation Xiaolan Zou
Convection Diffusion Cold Pulse Propagation • Strong convection (heat pinch) • Weak diffusion (soliton?) Fig.6 Time-space evolution of dTe/dt during SMBI with CHEC. Convection Diffusion Xiaolan Zou
Heat Transport with FFT Analysis • Phase sensitive to the diffusivity: . • Weak diffusivity in the case with CHEC. without CHEC without CHEC with CHEC with CHEC Fig.8 Parameters (c, V) used for the simulation of Fig.6. Fig.7 Amplitude and phase of the 1st harmonic of the Fourier transform of the modulated temperature by SMBI. Experimental (O) and simulation (-) results. Xiaolan Zou
Particle Transport with FFT analysis DTe inversion region CHEC q=1 w/o CHEC D=1.1m2/s, V=1.8m/s D=1.5m2/s, V=5.5m/s D=0.4m2/s, V=0.4m/s D=1.3m2/s,V=3.5m/s • Sharp decrease of the particle diffusivity inside of the temperature perturbation inversion region. • Particle pinch velocity observed in both cases. The pinch value in the case with CHEC is one third than that in the case without CHEC. • Barrier for particle transport found around the temperature inversion radius (grey area) for the case with CHEC. Fig.9 FFT analysis of the density modulation. Xiaolan Zou
Simulation with Analytical Transport Model Barrier Fig. 11 Particle diffusivity D and pinch velocity V used for simulation in Fig.10. Fig. 10 FFT analysis and simulation for density perturbation Xiaolan Zou
Energy Confinement • Improvement of the energy confinement in the case with CHEC: +30% • No improvement of the energy confinement in the case without CHEC. without CHEC with CHEC Fig.12 Confinement time during SMBI for the case with CHEC. Fig.13 Confinement time during SMBI for the case without CHEC. Xiaolan Zou
Energy Confinement • Improvement of the energy confinement for low density (ne<2x10¹⁹m-3). • No improvement of the energy confinement for high density. • Better improvement with ECRH. Fig.14 Confinement time ratio before and during SMBI as function of the density. Xiaolan Zou
Rotation Velocity with CHEC without CHEC Fig. 15 Poloidal rotation velocity measured by Doppler reflectometry. High density case withou CHEC. Fig. 16 Poloidal rotation velocity measured by Doppler reflectometry. Low density case with CHEC. Xiaolan Zou
Diffusion Convection Damping Source Alternative Approach • Cold source propagation • Strong convection • Weak diffusion Alternative Approach • Source effect negligible • No convection • Diffusivity variation effect k Turbulence propagation Xiaolan Zou
Turbulence Soliton and Zonal Flow • Drift-Wave-Zonal-Flow Turbulence Soliton • (Z. Gao, L. Chen, F. Zonca, Phy. Rev. Lett., 103 (2009)) • Non-linear Schrödinger equation • Linear dispersion • Non-linear self-trapping by scalar potential well created by zonal flow Xiaolan Zou
Simulation with Turbulence Soliton Xiaolan Zou
Zonal Flow Cold Pulse Positive Turbulence Solitons SMBI Negative Drift- Wave Turbulence Hot Pulse Mechanism Zonal Flow IsZonal Flow the mechanism for CHEC and soliton-like propagation of the cold pulse? Xiaolan Zou
Conclusions • CHEC effect observed with SMBI for low density. Similar threshold in density as pellet. • Improvement of the energy confinement by SMBI for low density. Better improvement with ECRH. • Plasma rotation change observed during SMBI for low density. • Weak diffusion and strong convection (pinch) for the cold pulse propagation in the case with CHEC or • Soliton like propagation of the turbulence governed by zonal flow • Simulation qualitatively with turbulence soliton. Xiaolan Zou
Heat soliton or Turbulence soliton ? Mechanism for the improvement of the energy confinement by SMBI. Correlation between CHEC and this improvement. Coupling between the heat and particle transport. Open Issues Xiaolan Zou
SMBI in OH for low density Hot pulse DTe inversion V=3m/s Cold pulse Injection V=4m/s Fig. 2 Zoom of the temperature perturbation during and after SMBI. Xiaolan Zou
Pellet in OH for low density Hot pulse Cold pulse V=4m/s Pellet Fig.4 2D image of Te perturbation with pellet. Xiaolan Zou
SMBI during ECRH for low density Hot pulse ECRH V=5m/s Cold pulse SMBI Fig.5 2D image of Te perturbation with SMBI during ECRH. Xiaolan Zou
SMBI in OH for high density V=7m/s SMBI Cold pulse Fig.6 2D image of Te perturbation with SMBI in OH for high density. Xiaolan Zou
Pellet in OH for high density V=8m/s Cold pulse Pellet Fig.7 2D image of Te perturbation with pellet in OH for high density. Xiaolan Zou
Heat Transport with FFT Analysis • Simulation results show sharp decrease of heat diffusivity. • Heat pinch velocity observed in both cases. The pinch value in the NLT case is half than that in the no NLT case. • Barrier found at the temperature inversion radius(grey area) for NLT case. q=1 DTe inversion region k=0.85m2/s, V=2.7m/s Vph=3.3m/s Fig. 8 FFT analysis of the temperature perturbation. k=0.15m2/s, V=1.4m/s Vph=1.4m/s Xiaolan Zou