Download
1 / 36
370 likes | 568 Views
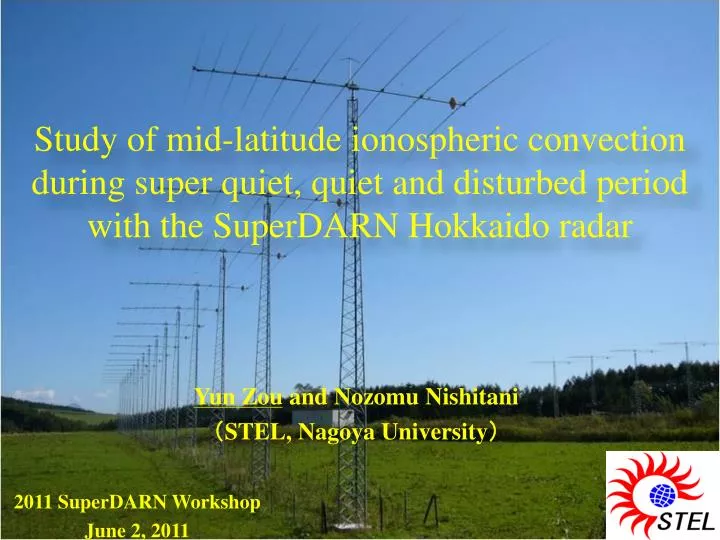
Study of mid-latitude ionospheric convection during super quiet, quiet and disturbed period with the SuperDARN Hokkaido radar. Yun Zou and Nozomu Nishitani ( STEL, Nagoya University ). 2011 SuperDARN Workshop June 2, 2011. Background(1/6).

E N D
Study of mid-latitude ionospheric convection during super quiet, quiet and disturbed period with the SuperDARN Hokkaido radar YunZouand Nozomu Nishitani (STEL, Nagoya University) 2011 SuperDARN Workshop June 2, 2011
Background(1/6) Reasons of generation of the mid-latitude ionosphere convection • Influence from high latitude convection (the penetrationelectric field) • Formation of convection by tide (which dominate at low latitude) • Disturbancedynamo(which provides very large influence at mid-latitude) Our study of mid-latitude ionosphere convection will forces on Disturbance dynamo effects.
Background(2/6) Observation result using Millstone Hill radar by Gonzales et al. [1978]and Richmond et al. [1980] And the empirical model Geomagnetic latitude:57 East Especially quiet time Less quiet time West Kelley and Rodney, 1989
Background(3/6) The Mechanism of disturbancedynamo Coriolis force change southward neutral wind to westward Joule heating UxB electric field (Pedersen current) Auroral electrojet ion drag force Charge appears due to the conductivity gradient - - westward ExB drift in the mid-latitude + + Night side morning Evening Blanc and Richmond, 1980
Background(4/6) • The result by the simulation of westward drift of F-region ionospheric plasma at mid-latitude develops with the growing of the storm. • In mid-latitude of Case I (night side), the speed of the westward plasma drift increases as the geomagnetic disturbance develops. East West Blanc and Richmond, 1980
Background(5/6) Ionospheric disturbance dynamos lasted up to 50 hours in the midlatitude region at night East • Observation point :Bundoora (145.1°E, 37.7°S geographic, 49°S magnetic), Australia • Observation equipment : Digisonde drift measurements • Statistical methods : Superposed Epoch Analysis (SEA) • Database : 5‐year (1999 to 2003) • Numbers of Dst-defined storms : 262 West Kumar et al., 2010
Background(6/6) Overview of disturbance dynamo at mid-latitude from Previous studies • Dominates at mid-latitude • Provides strong influence of westward flow • The influence becomes larger with the growth of storms • The influence may last for 50 hours Geomagnetic latitude dependence was not shown by the observation
Purpose of this study • To examine a geomagnetic index Kp and geomagnetic latitude dependence of the mid-latitude ionosphere plasma convection (especially the westward flow on the night side) for each season. • To examinegeomagnetic latitude dependenceof the chronological influence from the Dst-defined storm. SuperDARN Hokkaido radar • SuperDARN Hokkaido radar • Location : 43.5°N geographic, 36°N magnetic • Observation area : about 40°to 80°N
Method of this study • To study the geomagnetic activity dependence and the geomagnetic latitude dependence of the ionospheric mid-latitude conviction, we fit the vector by calculating the data from beam 1 to 14 obtained by the SuperDARN Hokkaido radar to get the westward and northward component of Doppler velocity. Then we plot the result in the polar map. • To study the geomagnetic latitude dependence of thechronologicalinfluence of magnetic storm, we use the Superposed Epoch Analysis (SEA) method by putting the -20h to 60h data of each Dst-defined storm together and fit them at 0h which is the start time of each storm.
Result(1/2) Statistical distribution of east-west velocities with several Kp ranges in winter (Nov to Jan) from December, 2006 to January, 2011. West Kp≦0+ and Kp<2+ for previous 50 hrs Kp≦0+ East 21 3 21 3 0+<Kp≦1+ 1+<Kp≦2+ Kp>2+ 21 3 21 3 21 3
Result(2/2) With increasing Kp index, westward flow becomes more intense in the nightside mid-latitude region. (m/s) East West
Resultof east-west component Discussion • Comparison with past studies • In contrast to the result of Gonzaleset al., night side eastward flow was not observed during deadly quiet periods. Why? • One important factor of gradient drift instability is most likely to generate ionospheric irregularities. • Gradient drift instability occurs when the electric field is strong enough, so that the ionospheric echoes are observed preferably when the electric field is strong(Fukumoto et al., 2000). • Westward flow is observed preferably when the electric field is strong. A Pedersen ion drift (to the right) leads to charge separation and the development of polarization electric fields, Ep. The sense of Ep drives Ep×B motion that further enhances the original plasma perturbation. TSUNODA, 1988
Result of chronological influence of magnetic storm(1/3) West In this study, the biggest storm happened on December 14, 2006. The value of Dst index felled down to -146nT. East 2006/12/15 2006/12/16 2006/12/17
Result of chronological influence of magnetic storm(2/3) *1 : 1 or less in seven hours satisfy the stated condition *2 : 3 or less in seven hours satisfy the stated condition *3 : All 7 consecutive hours satisfy the stated condition *4 : At lest 1 hour satisfy the stated condition • 48 storms defined by the hourly Dst index which satisfy the criteria, from December, 2006 to April, 2011. • We use the criteria adopted by Kumar et al., 2010.
Result of chronological influence of magnetic storm(3/3) We can’t find outstanding influence of storm from the result of all storms. This may be because relative number of short-duration storms is large. West All storms for westward flow of SEA response Medium- and long-duration storms for westward flow of SEA response East From the result of 5 events of medium- and long-duration storms we can confirm that the influence of storm lasts up to 20 hrs after onset between 43 and 47 degrees.
Summary(1/2) • The statistical analysis shows the geomagnetic index Kp and geomagnetic latitude dependence of the mid-latitude ionospheric plasma convection from the observation of SuperDARN Hokkaido radar in all seasons. The mid-latitudenight side westward flow has Kp dependence intensified for disturbed periods in all seasons. • But, even if the Kp was 0 to 0+ and the influence from the previous 50 hrs has been take out, the mid-latitude night side flow was westward, which is inconsistent with Gonzalez et al.’s result. This is considered to be because the westward flow was observed by the presence of ionospheric irregularity preferably when the convection electric field is strong, leading to the growth of gradient drift instability.
Summary(2/2) • The Superposed Epoch Analysis (SEA) result shows a latitude dependence of the influence from the storm. From the result of 5 events of medium- and long-duration storms we can confirm that the influence of storm lasts up to 20 hrs after onset at several latitude of mid-latitude. • In mid-latitude equatorward flow in winter and poleward flow in summer were observed on the night side. This is corresponding to the result of Mori(graduate research, 2009) and Richmond et al., 1980.
Future work • Further study of geomagnetic activity dependence (solar activity level and sub-storm dependence) of the mid-latitude ionospheric plasma convection is necessary. • More events of each duration storms need to be studied to extend the detailed result of data analysis. • Other possible factors to affect mid-latitude convection besides the disturbance dynamo should be investigated.
Result Statistical distribution of east-west velocities with several Kp ranges in winter (Nov to Jan) from December, 2006 to April, 2011. West Kp≦0+ and Kp<2+ for 50 hrs Kp≦0+ East 0+<Kp≦1+ 1+<Kp≦2+ Kp>2+
Statistical distribution of east-west velocities with several Kp ranges in spring (Feb to Apr) from December, 2006 to April, 2011. West Kp<0+ and Kp<2+ for 50 hrs Kp≦0+ East 0+<Kp≦1+ 1+<Kp≦2+ Kp>2+
Statistical distribution of east-west velocities with several Kp ranges in summer (May to Jul) from December, 2006 to April, 2011. West Kp<0+ and Kp<2+ for 50 hrs Kp≦0+ East 0+<Kp≦1+ 1+<Kp≦2+ Kp>2+
Statistical distribution of east-west velocities with several Kp ranges in autumn (Aug to Oct) from December, 2006 to April, 2011. West Kp<0+ and Kp<2+ for 50 hrs Kp≦0+ East 0+<Kp≦1+ 1+<Kp≦2+ Kp>2+
Result of north-south component Statistical distribution of north-south velocities in Summer(May to July) and Winter (Nov to Jan) from December, 2006 to April, 2011. Summer Winter South North All Kp
All storms for westward flow of SEA response
1. Background The observation by DE2 satellite of the east-west component of ion drift in mid-latitude Quiet time(Kp≦2) Disturbed time( Kp≧3) • With the growing of geomagnetic activity the drift for west becomes dominate near magnetic latitude 50 degrees on the night side. • In lower latitude the effect of tide is predominant . East West East West Heelis and Coley, 1992
1. Background In plasmasphere which relates to the ionosphere also has a drift for west in mid-latitude which calls co-rotation lag. Plasmasphere distribution caught by EUV camera equipped on IMAGE satellite on April 6-8, 2001 The forecast of the position of the notch observed by the DMSP ion drift meter that appears delaying because of the earth`s rotation. Burch and Goldstein, 2004
1. Background The observation of the Wallops SuperDARN radar which is located at magnetic latitude 49.4 degrees. • When geomagnetic activity is comparatively quiet(Kp≦3)。 • Ionosphere average convection pattern that is calculated form the observation data from June, 2005 to August, 2006. • In mid-latitude, the influence of the high latitude convection is far weaker, and movement for the west driven by the Disturbance dynamo action is more predominant. Baker et al., 2007
1. Background Quiet time(Kp≦3)average drift velocity observation and model result ISradar East West East West East West East West East West East West (G:44.1 M:40) (G:42.6, M:57) G: geography latitude M:geomagnetic latitude Richmond, 1980
1. Background Limit of the current observation • The ionosphere convection characteristic was chiefly observed with the IS radar like the Millstone Hill radar in the past. • It is possible only to observe an overhead ionosphere with IS radar which called ‘one point observation’, and give an observation result of one dimension. • It is more effective though two dimensions can be observed by using the SuperDARN radar and the low-altitude satellite, to examine ionospheric characteristics. Also because the low-altitude satellite give an observation while turning round the earth (It takes about 1 hour and 40 minutes around), a continuous observation may not be done. • Most of the SuperDARN radar was set up in the high latitude region, and there was no HF radar in the mid-latitude until SuperDARN Wallops radar and SuperDARN Hokkaido radar in recent years. Because the mid-latitude region from 40 to 50 degrees is not covered in the observation of the SuperDARN Wallops radar which sets up in a magnetic latitude 49.4 degrees, accurate convection pattern of this region cannot be understood. • The observation data of the SuperDARN Wallops radar is a incomplete because of the cause of the breakdown etc.
4.Result About the observation result of the SuperDARN Hokkaido radar • From Mori(graduate research, 2009), there is a seasonality variation of the plasma flow from a magnetic latitude 40 degrees to about 60 degrees. Especially, flow for the northwest was able to be observed on the night side in winter. --However, it is necessary to remove the influence of the ground scatter echo in other seasons without winter. • It is difficult to remove the ground scatter echo from the data of Doppler velocity observed by SuperDARN Hokkaido radar perfectly. --However, because of the ground scatter echo and the ionosphere scatter echo divide clearly at least in winter and the ground scatter is few on the night side of winter, it is dependable.
5.Discussion Discussion ② East West East West East West Comparison with past research • Even the geography latitude and the geomagnetic latitudewere almost the same with the St. Santin radar, the flow for the east at pre-midnight haven`t been observed. (G:42.6, M:57)
6. Summary Summary ① • It was clarified that there was geomagnetism index Kp dependency of the mid-latitude ionosphere plasma convection from the observation of SuperDARN Hokkaido radar at each season. • Especially, it was clarified that the flow for the west on the night side in mid-latitude at each season has a geomagnetism index Kp dependency. --However, when geomagnetism index Kp indicated the value below 0+, the flow for the west on the night side in mid-latitude was also be confirmed. This is thought to be the observation of the flow for west by priority when the convection electric field is strong because the gradient drift instability.
6. Summary Summary ② • In mid-latitude a flow for the equator in winter and a flow for the pole in summer was observed on the night side. This is corresponding to the result of Mori(graduate research, 2009) and Richmond et al., 1980. • The convection cell in high latitude was observed to develop down to lower latitude along with the increasing of the geomagnetism index Kp.