Download
1 / 67
670 likes | 824 Views
Perspective of SCMA IV from Particle Physics. Louis Lyons Particle Physics, Oxford (CDF experiment, Fermilab) l.lyons@physics.ox.ac.uk SCMA IV Penn State 15 th June 2006. Topics.

E N D
Perspective of SCMA IV from Particle Physics Louis Lyons Particle Physics, Oxford (CDF experiment, Fermilab) l.lyons@physics.ox.ac.uk SCMA IV Penn State 15th June 2006
Topics • Basic Particle Physics analyses • Similarities between Particles and Astrophysics issues • Differences • What Astrophysicists do particularly well • What Particle Physicists have learnt • Conclusions
Particle Physics • What it is • Typical experiments • Typical data • Typical analysis
Typical Experiments • Experiment Energy Beams # events Result • LEP 200 GeV e+ e- 107 Z N = 2.987± 0.008 • BaBar/Belle 10 GeV e+ e- 108 B anti-B CP-violation • Tevatron 2000 GeV p anti-p “1014” SUSY? • LHC 14000 GeV p p (2007…) Higgs? • KK ~3 GeV νμ 100 ν oscillations
TypicalAnalysis • Parameter determination: dn/dt = 1/τ * exp(-t / τ) Worry about backgrounds, t resolution, t-dependent efficiency • 1) Reconstruct tracks • 2) Select real events • 3) Select wanted events • 4) Extract t from L and v • 5) Model signal and background • 6) Likelihood fit for lifetime and statistical error • 7) Estimate systematic error τ± στ(stat)± στ(syst)
TypicalAnalysis Hypothesis testing: Peak or statistical fluctuation?
Similarities • Large data sets {ATLAS: event = Mbyte; total = 10 Pbytes} • Experimental resolution • Systematics • Separating signal from background • Parameter estimation • Testing models (versus alternative?) • Search for signals: Setting limits or Discovery • SCMA and PHYSTAT
Differences • Bayes or Frequentism? • Background • Specific Astrophysics issues Time dependence Spatial structures Correlations Non-parametric methods Visualisation Cosmic variance • Blind analyses `
Bayesian versus Frequentism BayesianFrequentist
Bayesian versus Frequentism Bayesian Frequentist
Bayesianism versus Frequentism “Bayesians address the question everyone is interested in, by using assumptions no-one believes” “Frequentists use impeccable logic to deal with an issue of no interest to anyone”
Differences • Bayes or Frequentism? • Background • Specific Astrophysics issues Time dependence Spatial structures Correlations Non-parametric methods Visualisation Cosmic variance • Blind analyses `
What Astrophysicists do well • Glorious pictures • Sharing data • Making data publicly available • Dealing with large data sets • Visualisation • Funding for Astrostatistics • Statistical software
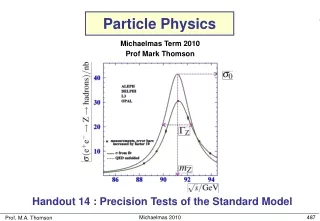
Whirlpool Galaxy Width of Z0 3 light neutrinos
What Astrophysicists do well • Glorious pictures • Sharing data • Making data publicly available • Dealing with large data sets • Visualisation • Funding for Astrostatistics • Statistical software
What Particle Physicists now know • (ln L) = 0.5 rule • Unbinned Lmax and Goodness of fit • Prob (data | hypothesis) ≠ Prob (hypothesis | data) • Comparing 2 hypotheses • Δ(c 2) ≠c 2 • Bounded parameters: Feldman and Cousins • Use correct L (Punzi effect) • Blind analyses
ΔlnL = -1/2 rule If L(μ) is Gaussian, following definitions of σ are equivalent: 1) RMS of L(µ) 2) 1/√(-d2L/dµ2) 3) ln(L(μ±σ) = ln(L(μ0)) -1/2 If L(μ) is non-Gaussian, these are no longer the same “Procedure 3) above still gives interval that contains the true value of parameter μ with 68% probability” Heinrich: CDF note 6438 (see CDF Statistics Committee Web-page) Barlow: Phystat05
COVERAGE How often does quoted range for parameter include param’s true value? N.B. Coverage is a property of METHOD, not of a particular exptl result Coverage can vary with Study coverage of different methods of Poisson parameter , from observation of number of events n Hope for: 100% Nominalvalue
COVERAGE If true for all : “correct coverage” P< for some “undercoverage” (this is serious !) P> for some “overcoverage” Conservative Loss of rejection power
Coverage : L approach (Not frequentist) P(n,μ) = e-μμn/n! (Joel Heinrich CDF note 6438) -2 lnλ< 1 λ = P(n,μ)/P(n,μbest) UNDERCOVERS
Frequentist central intervals, NEVER undercover(Conservative at both ends)
= (n-µ)2/µ Δ = 0.1 24.8% coverage? • NOT frequentist : Coverage = 0% 100%
Unbinned Lmax and Goodness of Fit? Find params by maximising L So larger L better than smaller L So Lmax gives Goodness of Fit?? Bad Good? Great? Monte Carlo distribution of unbinned Lmax Frequency Lmax
Not necessarily: pdf L (data,params) fixedvaryL Contrast pdf (data,params) param vary fixed data e.g. p(t|λ) = λ e -λt Max at t = 0 Max at λ =1/ t pL tλ Unbinned Lmax and Goodness of Fit?
Lmax and Goodness of Fit? Example 1 Fit exponential to times t1, t2 ,t3 ……. [Joel Heinrich, CDF 5639] L = ln Lmax = -N(1 + ln tav) i.e. Depends only on AVERAGE t, but is INDEPENDENT OF DISTRIBUTION OF t (except for……..) (Average t is a sufficient statistic) Variation of Lmax in Monte Carlo is due to variations in samples’ average t , but NOT TO BETTER OR WORSE FIT pdf Same average t same Lmax t
Example 2 Lmax and Goodness of Fit? 1 + α cos2θ L = cos θ pdf (and likelihood) depends only on cos2 θi Insensitive to sign of cos θi So data can be in very bad agreement with expected distribution e.g. All data with cos θ< 0 and Lmax does not know about it. Example of general principle
Lmax and Goodness of Fit? Example 3 Fit to Gaussian with variable μ, fixed σ ln Lmax = N(-0.5 ln2π – lnσ) – 0.5 Σ(xi – xav)2 / σ2 constant ~variance(x) i.e. Lmax depends only on variance(x), which is not relevant for fitting μ (μest = xav) Smaller than expected variance(x) results in larger Lmax x x Worse fit, larger Lmax Better fit, lower Lmax
Transformation properties of pdf and L Lifetime example: dn/dt = λ e –λt Change observable from t to y = √t dn/dy = (dn/dt) (dt/dy) = 2 y λ exp(–λy2) So (a) pdf CHANGES but (b) i.e. corresponding integrals of pdf are INVARIANT
Now for Likelihood When parameter changes from λ to τ = 1/λ (a’) L does not change dn/dt = 1/τ exp{-t/τ} and so L(τ;t) = L(λ=1/τ;t) because identical numbers occur in evaluations of the two L’s BUT (b’) So it is NOT meaningful to integrate L (However,………)
CONCLUSION: • NOT recognised statistical procedure • [Metric dependent: • τ range agrees with τpred • λ range inconsistent with 1/τpred] • BUT • Could regard as “black box” • Make respectable by L Bayes’ posterior • Posterior(λ) ~ L(λ)* Prior(λ) [and Prior(λ) can be constant]
P (Data;Theory) P (Theory;Data) Theory = male or female Data = pregnant or not pregnant P (pregnant ; female) ~ 3%
P (Data;Theory) P (Theory;Data) Theory = male or female Data = pregnant or not pregnant P (pregnant ; female) ~ 3% but P (female ; pregnant) >>>3%
P (Data;Theory) P (Theory;Data) HIGGS SEARCH at CERN Is data consistent with Standard Model? or with Standard Model + Higgs? End of Sept 2000 Data not very consistent with S.M. Prob (Data ; S.M.) < 1% valid frequentist statement Turned by the press into: Prob (S.M. ; Data) < 1% and therefore Prob (Higgs ; Data) > 99% i.e. “It is almost certain that the Higgs has been seen”
p-value ≠ Prob of hypothesis being correct Given data and H0 = null hypothesis, Construct statistic T (e.g. χ2) p-value = probability {T tobserved}, assuming H0 = true If p = 10-3, what is prob that H0 = true? e.g. Try to identify μ in beam (H0: particle = μ) with π contam. Prob (H0) depends on a) similarity of μ and π masses b) relative populations of μ and π If N(π) ~ N(μ), prob(H0) 0.5 If N(π) N(μ), prob(H0) ~ 1 0 p 1 If N(π) ~10*N(μ), prob(H0) ~ 0.1 i.e. prob(H0) varies with p-value, but is not equal to it
p-value ≠ Prob of hypothesis being correct After Conference Banquet speech: “Of those results that have been quoted as significant at the 99% level, about half have turned out to be wrong!” Supposed to be funny, but in fact is perfectly OK
PARADOX Histogram with 100 bins Fit 1 parameter Smin: χ2 with NDF = 99 (Expected χ2 = 99 ± 14) For our data, Smin(p0) = 90 Is p1 acceptable if S(p1) = 115? • YES. Very acceptable χ2 probability • NO. σp from S(p0 +σp) = Smin +1 = 91 But S(p1) – S(p0) = 25 So p1 is 5σ away from best value
χ2 with ν degrees of freedom? • ν = data – free parameters ? Why asymptotic (apart from Poisson Gaussian) ? a) Fit flatish histogram with y = N {1 + 10-6 cos(x-x0)} x0 = free param b) Neutrino oscillations: almost degenerate parameters y ~ 1 – A sin2(1.27 Δm2 L/E) 2 parameters 1 – A (1.27 Δm2 L/E)2 1 parameter Small Δm2
χ2 with ν degrees of freedom? 2) Is difference in χ2 distributed as χ2 ? H0 is true. Also fit with H1 with k extra params e. g. Look for Gaussian peak on top of smooth background y = C(x) + A exp{-0.5 ((x-x0)/σ)2} Is χ2H0 - χ2H1 distributed as χ2 withν = k = 3 ? Relevant for assessing whether enhancement in data is just a statistical fluctuation, or something more interesting N.B. Under H0 (y = C(x)) : A=0 (boundary of physical region) x0 and σ undefined
Is difference in χ2 distributed as χ2 ? Demortier: H0 = quadratic bgd H1 =……… + Gaussian of fixed width • Protassov, van Dyk, Connors, …. • H0 = continuum • H1 = narrow emission line • H1 = wider emission line • H1 = absorption line • Nominal significance level = 5%
Is difference in χ2 distributed as χ2 ? • So need to determine the Δχ2 distribution by Monte Carlo • N.B. • Determining Δχ2 for hypothesis H1 when data is generated according to H0 is not trivial, because there will be lots of local minima • If we are interested in5σ significance level, needs lots of MC simulations