Download
1 / 57
570 likes | 687 Views
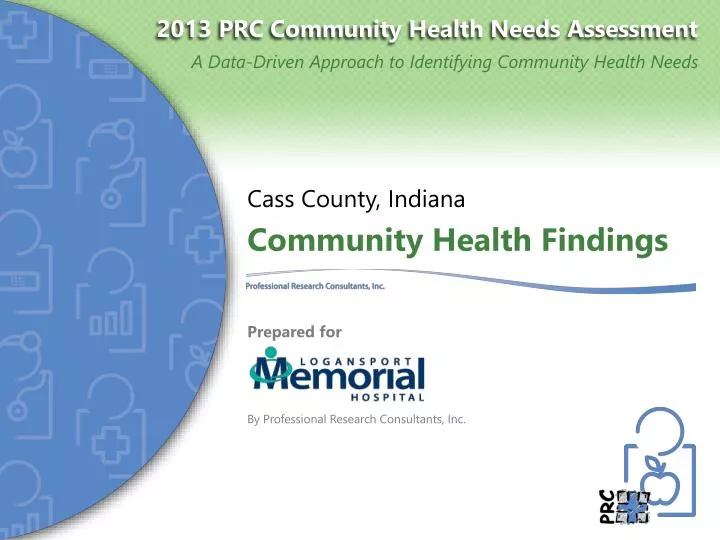
Community Health Findings. Cass County, Indiana. Prepared for. By Professional Research Consultants, Inc. Customized Local PRC Community Health Survey. PRC Community Health Needs Assessment. Surveys among 400 adults in Cass County, Indiana Random distribution

E N D
Community Health Findings Cass County, Indiana Prepared for By Professional Research Consultants, Inc.
Customized LocalPRC Community Health Survey PRC Community Health Needs Assessment • Surveys among 400 adults in Cass County, Indiana • Random distribution • 144 survey items; 25-30 minute interview • ±4.9% max error overall BENCHMARKING PRC National Health Survey State BRFSS data Healthy People 2020 targets National vital statistics data Secondary Data Key Informant Focus Groups • Four Key Informant Focus Groups, comprised of 16 community stakeholders: • Public health, physicians & other health providers • Social services & other community leaders
Population & Sample Characteristics(Cass County, 2013) Sources: ● Census 2010, Summary File 3 (SF 3). U.S. Census Bureau. ● 2013 PRC Community Health Survey, Professional Research Consultants, Inc.
This Presentation Represents just a fraction of the data collected through this assessment. Focuses on areas of need; however, there were many positive findings for the region as well. Will allow for Q&A at the end.
General Health Status • Areas of Opportunity • Access to Health Services • Cancer • Diabetes • Heart Disease & Stroke • Injury & Violence • Maternal, Infant & Child Health • Mental Health & Mental Disorders • Nutrition, Physical Activity & Weight • Oral Health • Respiratory Disease • Tobacco Use • Next Steps
General Health Status • Areas of Opportunity • Access to Health Services • Cancer • Diabetes • Heart Disease & Stroke • Injury & Violence • Maternal, Infant & Child Health • Mental Health & Mental Disorders • Nutrition, Physical Activity & Weight • Oral Health • Respiratory Disease • Tobacco Use • Next Steps
Self-Reported Health Status(Cass County, 2013) “Would you say that, in general, your health is excellent, very good, good, fair or poor?” “Fair/Poor” = 12.5% “Excellent/Very Good” = 46.3% Sources: ● 2013 PRC Community Health Survey, Professional Research Consultants, Inc. [Item 5] Notes: ● Asked of all respondents.
Experience “Fair” or “Poor” Overall Health Sources: ● 2013 PRC Community Health Survey, Professional Research Consultants, Inc. [Item 5] ● Behavioral Risk Factor Surveillance System Survey Data. Atlanta, Georgia. United States Department of Health and Human Services, Centers for Disease Control and Prevention (CDC): 2011 Indiana data. ● 2011 PRC National Health Survey, Professional Research Consultants, Inc. Notes: ● Asked of all respondents.
Experience “Fair” or “Poor” Overall Health(Cass County, 2013) Sources: ● 2013 PRC Community Health Survey, Professional Research Consultants, Inc. [Item 5] Notes: ● Asked of all respondents. ● Income categories reflect respondent's household income as a ratio to the federal poverty level (FPL) for their household size. “Low Income” includes households with incomes up to 200% of the federal poverty level; “Mid/High Income” includes households with incomes at 200% or more of the federal poverty level.
General Health Status • Areas of Opportunity • Access to Health Services • Cancer • Diabetes • Heart Disease & Stroke • Injury & Violence • Maternal, Infant & Child Health • Mental Health & Mental Disorders • Nutrition, Physical Activity & Weight • Oral Health • Respiratory Disease • Tobacco Use • Next Steps
General Health Status • Areas of Opportunity • Access to Health Services • Cancer • Diabetes • Heart Disease & Stroke • Injury & Violence • Maternal, Infant & Child Health • Mental Health & Mental Disorders • Nutrition, Physical Activity & Weight • Oral Health • Respiratory Disease • Tobacco Use • Next Steps
Healthcare Insurance Coverage(Among Adults 18-64; Cass County, 2013) Private = 62.9% Gov’t = 23.6% Uninsured = 13.6% Sources: ● 2013 PRC Community Health Survey, Professional Research Consultants, Inc. [Item 198] Notes: ● Reflects respondents age 18 to 64.
Lack of Healthcare Insurance Coverage(Among Adults 18-64) Healthy People 2020 Target = 0.0% (Universal Coverage) Sources: ● 2013 PRC Community Health Survey, Professional Research Consultants, Inc. [Item 198] ● Behavioral Risk Factor Surveillance System Survey Data. Atlanta, Georgia. United States Department of Health and Human Services, Centers for Disease Control and Prevention (CDC): 2011 Indiana data. ● 2011 PRC National Health Survey, Professional Research Consultants, Inc. ● US Department of Health and Human Services. Healthy People 2020. December 2010. http://www.healthypeople.gov [Objective AHS-1] Notes: ● Asked of all respondents under the age of 65.
Lack of Healthcare Insurance Coverage(Among Adults 18-64; Cass County, 2013) Healthy People 2020 Target = 0.0% (Universal Coverage) Sources: ● 2013 PRC Community Health Survey, Professional Research Consultants, Inc. [Item 198] ● US Department of Health and Human Services. Healthy People 2020. December 2010. http://www.healthypeople.gov [Objective AHS-1] Notes: ● Asked of all respondents under the age of 65. ● Income categories reflect respondent's household income as a ratio to the federal poverty level (FPL) for their household size. “Low Income” includes households with incomes up to 200% of the federal poverty level; “Mid/High Income” includes households with incomes at 200% or more of the federal poverty level.
Barriers to Access Have Prevented Medical Care in the Past Year Access to care is generally better in Cass County than found nationally. Sources: ● 2013 PRC Community Health Survey, Professional Research Consultants, Inc. [Items 7-12] ● 2011 PRC National Health Survey, Professional Research Consultants, Inc. Notes: ● Asked of all respondents.
Experienced Difficulties or Delays of Some Kindin Receiving Needed Healthcare in the Past Year(Cass County, 2013) Sources: ● 2013 PRC Community Health Survey, Professional Research Consultants, Inc. [Item 202] Notes: ● Asked of all respondents. ● Represents the percentage of respondents experiencing one or more barriers to accessing healthcare in the past 12 months. ● Income categories reflect respondent's household income as a ratio to the federal poverty level (FPL) for their household size. “Low Income” includes households with incomes up to 200% of the federal poverty level; “Mid/High Income” includes households with incomes at 200% or more of the federal poverty level.
Have a Specific Source of Ongoing Medical Care Sources: ● 2013 PRC Community Health Survey, Professional Research Consultants, Inc. [Item 199] ● 2011 PRC National Health Survey, Professional Research Consultants, Inc. ● US Department of Health and Human Services. Healthy People 2020. December 2010. http://www.healthypeople.gov [Objective AHS-5.1] Notes: ● Asked of all respondents. Particularly low (62.0%) among low-income residents.
Key Informant Focus Group Access to Health Services Ranked as the #2 top concern among focus group participants. They emphasized: Barriers to Access Poverty Transportation Limited hours of operation Interpretive services Limited Number of Physicians Available
General Health Status • Areas of Opportunity • Access to Health Services • Cancer • Diabetes • Heart Disease & Stroke • Injury & Violence • Maternal, Infant & Child Health • Mental Health & Mental Disorders • Nutrition, Physical Activity & Weight • Oral Health • Respiratory Disease • Tobacco Use • Next Steps
Cancer: Age-Adjusted Mortality(2008-2010 Annual Average Deaths per 100,000 Population) Cancer is #2 leading cause of death in Cass County (23.4% of 2008-2010 deaths) Sources: ● CDC WONDER Online Query System. Centers for Disease Control and Prevention, Epidemiology Program Office, Division of Public Health Surveillance and Informatics. Data extracted April 2013. ● US Department of Health and Human Services. Healthy People 2020. December 2010. http://www.healthypeople.gov [Objective C-1] Notes: ● Deaths are coded using the Tenth Revision of the International Statistical Classification of Diseases and Related Health Problems (ICD-10). ● Rates are per 100,000 population, age-adjusted to the 2000 U.S. Standard Population. ● Local, state and national data are simple three-year averages.
Have Had a Pap Smear in the Past Three Years(Among Women 21-65) Have Ever Had a Lower Endoscopy Exam(Among Adults 50+) Sources: ● 2013 PRC Community Health Survey, Professional Research Consultants, Inc. [Items 152-154] ● Behavioral Risk Factor Surveillance System Survey Data. Atlanta, Georgia. United States Department of Health and Human Services, Centers for Disease Control and Prevention (CDC): 2010 Indiana data. ● 2011 PRC National Health Survey, Professional Research Consultants, Inc. ● US Department of Health and Human Services. Healthy People 2020. December 2010. http://www.healthypeople.gov [Objective C-15] Notes: ● [Pap Smear] Reflects female respondents age 21-65. ● *Note that the Indiana percentage represents all women 18 and older. ● [Lower Endoscopy] Asked of all respondents 50+. ● Lower endoscopy includes either sigmoidoscopy or colonoscopy.
General Health Status • Areas of Opportunity • Access to Health Services • Cancer • Diabetes • Heart Disease & Stroke • Injury & Violence • Maternal, Infant & Child Health • Mental Health & Mental Disorders • Nutrition, Physical Activity & Weight • Oral Health • Respiratory Disease • Tobacco Use • Next Steps
Prevalence of Diabetes(Cass County, 2013) Sources: ● 2013 PRC Community Health Survey, Professional Research Consultants, Inc. [Item 44] Notes: ● Asked of all respondents. ● Income categories reflect respondent's household income as a ratio to the federal poverty level (FPL) for their household size. “Low Income” includes households with incomes up to 200% of the federal poverty level; “Mid/High Income” includes households with incomes at 200% or more of the federal poverty level. ● Excludes gestation diabetes (occurring only during pregnancy).
Diabetes: Age-Adjusted Mortality(2008-2010 Annual Average Deaths per 100,000 Population) Sources: ● CDC WONDER Online Query System. Centers for Disease Control and Prevention, Epidemiology Program Office, Division of Public Health Surveillance and Informatics. Data extracted April 2013. ● US Department of Health and Human Services. Healthy People 2020. December 2010. http://www.healthypeople.gov [Objective D-3] Notes: ● Deaths are coded using the Tenth Revision of the International Statistical Classification of Diseases and Related Health Problems (ICD-10). ● Rates are per 100,000 population, age-adjusted to the 2000 U.S. Standard Population. ● Local, state and national data are simple three-year averages. ● The Healthy People 2020 target for Diabetes is adjusted to account for only diabetes mellitus coded deaths.
General Health Status • Areas of Opportunity • Access to Health Services • Cancer • Diabetes • Heart Disease & Stroke • Injury & Violence • Maternal, Infant & Child Health • Mental Health & Mental Disorders • Nutrition, Physical Activity & Weight • Oral Health • Respiratory Disease • Tobacco Use • Next Steps
Heart Disease: Age-Adjusted Mortality(2008-2010 Annual Average Deaths per 100,000 Population) #1 leading cause of death in Cass County (24.1% of 2008-2010 deaths) Sources: ● CDC WONDER Online Query System. Centers for Disease Control and Prevention, Epidemiology Program Office, Division of Public Health Surveillance and Informatics. Data extracted April 2013. ● US Department of Health and Human Services. Healthy People 2020. December 2010. http://www.healthypeople.gov [Objective HDS-2] Notes: ● Deaths are coded using the Tenth Revision of the International Statistical Classification of Diseases and Related Health Problems (ICD-10). ● Rates are per 100,000 population, age-adjusted to the 2000 U.S. Standard Population. ● Local, state and national data are simple three-year averages. ● The Healthy People 2020 Heart Disease target is adjusted to account for all diseases of the heart.
Prevalence of High Blood Pressure(Cass County, 2013) Sources: ● 2013 PRC Community Health Survey, Professional Research Consultants, Inc. [Item 147] ● US Department of Health and Human Services. Healthy People 2020. December 2010. http://www.healthypeople.gov [Objective HDS-5.1] Notes: ● Asked of all respondents. ● Income categories reflect respondent's household income as a ratio to the federal poverty level (FPL) for their household size. “Low Income” includes households with incomes up to 200% of the federal poverty level; “Mid/High Income” includes households with incomes at 200% or more of the federal poverty level. In all, a high 90.0% of adults exhibit one or more cardiovascular risk factors (overweight, smoking, high blood pressure/cholesterol, lack of exercise)
General Health Status • Areas of Opportunity • Access to Health Services • Cancer • Diabetes • Heart Disease & Stroke • Injury & Violence • Maternal, Infant & Child Health • Mental Health & Mental Disorders • Nutrition, Physical Activity & Weight • Oral Health • Respiratory Disease • Tobacco Use • Next Steps
Motor Vehicle Crashes: Age-Adjusted Mortality(Annual Average Deaths per 100,000 Population) Sources: ● CDC WONDER Online Query System. Centers for Disease Control and Prevention, Epidemiology Program Office, Division of Public Health Surveillance and Informatics. Data extracted April 2013. ● Indiana State Department of Health ● US Department of Health and Human Services. Healthy People 2020. December 2010. http://www.healthypeople.gov [Objective IVP-13.1] Notes: ● Deaths are coded using the Tenth Revision of the International Statistical Classification of Diseases and Related Health Problems (ICD-10). ● Rates are per 100,000 population, age-adjusted to the 2000 U.S. Standard Population.
“Always” Wear a Seat BeltWhen Driving or Riding in a Vehicle Sources: ● 2013 PRC Community Health Survey, Professional Research Consultants, Inc. [Item 53] ● 2011 PRC National Health Survey, Professional Research Consultants, Inc. ● Behavioral Risk Factor Surveillance System Survey Data. Atlanta, Georgia. United States Department of Health and Human Services, Centers for Disease Control and Prevention (CDC): 2011 Indiana data. ● US Department of Health and Human Services. Healthy People 2020. December 2010. http://www.healthypeople.gov [Objective IPV-15] Notes: ● Asked of all respondents. Particularly low in men, adults 18-39
Have a Firearm Kept in or Around the Home 11.3% of firearm owners keep at least one weapon unlocked and loaded Sources: ● 2013 PRC Community Health Survey, Professional Research Consultants, Inc. [Items 57,159] ● 2011 PRC National Health Survey, Professional Research Consultants, Inc. Notes: ● Asked of all respondents. ● In this case, firearms include pistols, shotguns, rifles, and other types of guns; this does not include starter pistols, BB guns, or guns that cannot fire.
General Health Status • Areas of Opportunity • Access to Health Services • Cancer • Diabetes • Heart Disease & Stroke • Injury & Violence • Maternal, Infant & Child Health • Mental Health & Mental Disorders • Nutrition, Physical Activity & Weight • Oral Health • Respiratory Disease • Tobacco Use • Next Steps
Lack of Prenatal Care in the First Trimester(Percentage of Live Births, 2008) Sources: ● Indiana Youth Institute (www.iyi.org) County Snapshots ● US Department of Health and Human Services. Healthy People 2020. December 2010. http://www.healthypeople.gov [Objective MICH-10.1] Note: ● Numbers are a percentage of all live births within each population.
General Health Status • Areas of Opportunity • Access to Health Services • Cancer • Diabetes • Heart Disease & Stroke • Injury & Violence • Maternal, Infant & Child Health • Mental Health & Mental Disorders • Nutrition, Physical Activity & Weight • Oral Health • Respiratory Disease • Tobacco Use • Next Steps
Experience “Fair” or “Poor” Mental Health(Cass County, 2013) Self-Reported Mental Health Status Excellent/Very Good = 66.2% Good = 25.9% Fair/Poor = 7.8% (better than US) Sources: ● 2013 PRC Community Health Survey, Professional Research Consultants, Inc. [Item 117] Notes: ● Asked of all respondents. ● Income categories reflect respondent's household income as a ratio to the federal poverty level (FPL) for their household size. “Low Income” includes households with incomes up to 200% of the federal poverty level; “Mid/High Income” includes households with incomes at 200% or more of the federal poverty level.
Have Been Diagnosed With Major Depression(Cass County, 2013) Depression indicators are overall similar to US findings, however… Have Experienced Symptoms of Chronic Depression(Cass County, 2013) Sources: ● 2013 PRC Community Health Survey, Professional Research Consultants, Inc. [Item 33] Notes: ● Asked of all respondents. ● Income categories reflect respondent's household income as a ratio to the federal poverty level (FPL) for their household size. “Low Income” includes households with incomes up to 200% of the federal poverty level; “Mid/High Income” includes households with incomes at 200% or more of the federal poverty level. The percentage of adults having ever sought help for mental health issues (18.7%) is relatively low compared to US findings (24.4%).
Mental Health Ranked as the #4 top concern among focus group participants. They emphasized: Limited Resources Available (Providers & Services) Cost/Insurance Issues Stigma Key Informant Focus Group
General Health Status • Areas of Opportunity • Access to Health Services • Cancer • Diabetes • Heart Disease & Stroke • Injury & Violence • Maternal, Infant & Child Health • Mental Health & Mental Disorders • Nutrition, Physical Activity & Weight • Oral Health • Respiratory Disease • Tobacco Use • Next Steps
Consume Five or More Servings of Fruits/Vegetables Per Day Cass County adults are less likely than Americans overall to have received information or advice about nutrition from a health professional in the past year. Sources: ● 2013 PRC Community Health Survey, Professional Research Consultants, Inc. [Item 174] ● 2011 PRC National Health Survey, Professional Research Consultants, Inc. Notes: ● Asked of all respondents. ● For this issue, respondents were asked to recall their food intake on the previous day.
No Leisure-Time Physical Activity in the Past Month Cass County adults are less likely than Americans overall to have received information or advice about physical activity from a health professional in the past year. Sources: ● 2013 PRC Community Health Survey, Professional Research Consultants, Inc. [Item 109] ● Behavioral Risk Factor Surveillance System Survey Data. Atlanta, Georgia. United States Department of Health and Human Services, Centers for Disease Control and Prevention (CDC): 2011 Indiana data. ● 2011 PRC National Health Survey, Professional Research Consultants, Inc. ● US Department of Health and Human Services. Healthy People 2020. December 2010. http://www.healthypeople.gov [Objective PA-1] Notes: ● Asked of all respondents.
Moderate & Vigorous Physical Activity(Cass County, 2013) US=23.9% US=34.8% Sources: ● 2013 PRC Community Health Survey, Professional Research Consultants, Inc. [Items 179-180] ● 2011 PRC National Health Survey, Professional Research Consultants, Inc. Notes: ● Asked of all respondents. ● Moderate Physical Activity: Takes part in exercise that produces only light sweating or a slight to moderate increase in breathing or heart rate at least 5 times per week for at least 30 minutes per time. ● Vigorous Physical Activity: Takes part in activities that cause heavy sweating or large increases in breathing or heart rate at least 3 times per week for at least 20 minutes per time.
Meets Physical Activity Recommendations(Cass County, 2013) Sources: ● 2013 PRC Community Health Survey, Professional Research Consultants, Inc. [Item 177] Notes: ● Asked of all respondents. ● Income categories reflect respondent's household income as a ratio to the federal poverty level (FPL) for their household size. “Low Income” includes households with incomes up to 200% of the federal poverty level; “Mid/High Income” includes households with incomes at 200% or more of the federal poverty level. ● In this case the term “meets physical activity recommendations” refers to participation in moderate physical activity (exercise that produces only light sweating or a slight to moderate increase in breathing or heart rate ) at least 5 times a week for 30 minutes at a time, and/or vigorous physical activity (activities that cause heavy sweating or large increases in breathing or heart rate) at least 3 times a week for 20 minutes at a time.
Nutrition, Physical Activity & Weight Ranked as the #1 top concern among focus group participants. They emphasized: Poor Nutrition Lack of Education About Healthy Living Sedentary Lifestyles Low Youth Participation in Athletics Key Informant Focus Group
General Health Status • Areas of Opportunity • Access to Health Services • Cancer • Diabetes • Heart Disease & Stroke • Injury & Violence • Maternal, Infant & Child Health • Mental Health & Mental Disorders • Nutrition, Physical Activity & Weight • Oral Health • Respiratory Disease • Tobacco Use • Next Steps
Have Visited a Dentist orDental Clinic Within the Past Year Sources: ● 2013 PRC Community Health Survey, Professional Research Consultants, Inc. [Item 21] ● 2011 PRC National Health Survey, Professional Research Consultants, Inc. ● US Department of Health and Human Services. Healthy People 2020. December 2010. http://www.healthypeople.gov [Objective OH-7] ● Behavioral Risk Factor Surveillance System Survey Data. Atlanta, Georgia. United States Department of Health and Human Services, Centers for Disease Control and Prevention (CDC): 2011 Indiana data. Notes: ● Asked of all respondents.
Have Visited a Dentist orDental Clinic Within the Past Year(Cass County, 2013) Sources: ● 2013 PRC Community Health Survey, Professional Research Consultants, Inc. [Item 21] ● US Department of Health and Human Services. Healthy People 2020. December 2010. http://www.healthypeople.gov [Objective OH-7] Notes: ● Asked of all respondents. ● Income categories reflect respondent's household income as a ratio to the federal poverty level (FPL) for their household size. “Low Income” includes households with incomes up to 200% of the federal poverty level; “Mid/High Income” includes households with incomes at 200% or more of the federal poverty level. For kids, recent dental visits also appear low, but not to a statistically significant degree.
General Health Status • Areas of Opportunity • Access to Health Services • Cancer • Diabetes • Heart Disease & Stroke • Injury & Violence • Maternal, Infant & Child Health • Mental Health & Mental Disorders • Nutrition, Physical Activity & Weight • Oral Health • Respiratory Disease • Tobacco Use • Next Steps
Chronic Lower Respiratory Disease: Age-Adjusted Mortality(2008-2010 Annual Average Deaths per 100,000 Population) Pneumonia/Influenza: Age-Adjusted Mortality(2008-2010 Annual Average Deaths per 100,000 Population) Sources: ● CDC WONDER Online Query System. Centers for Disease Control and Prevention, Epidemiology Program Office, Division of Public Health Surveillance and Informatics. Data extracted April 2013. Notes: ● Deaths are coded using the Tenth Revision of the International Statistical Classification of Diseases and Related Health Problems (ICD-10). ● Rates are per 100,000 population, age-adjusted to the 2000 U.S. Standard Population. ● Local, state and national data are simple three-year averages. ● CLRD is chronic lower respiratory disease. Recall that the lung cancer death rate is also high.
General Health Status • Areas of Opportunity • Access to Health Services • Cancer • Diabetes • Heart Disease & Stroke • Injury & Violence • Maternal, Infant & Child Health • Mental Health & Mental Disorders • Nutrition, Physical Activity & Weight • Oral Health • Respiratory Disease • Tobacco Use • Next Steps
Current Smokers(Cass County, 2013) Note that 25.4% of 2008 births in Cass County were to women who smoked during pregnancy. Sources: ● 2013 PRC Community Health Survey, Professional Research Consultants, Inc. [Items 190-191] ● US Department of Health and Human Services. Healthy People 2020. December 2010. http://www.healthypeople.gov [Objective TU-1.1] Notes: ● Asked of all respondents. ● Income categories reflect respondent's household income as a ratio to the federal poverty level (FPL) for their household size. “Low Income” includes households with incomes up to 200% of the federal poverty level; “Mid/High Income” includes households with incomes at 200% or more of the federal poverty level. ● Includes regular and occasion smokers (everyday and some days).