Download
1 / 124
1.24k likes | 1.35k Views
Community Profile 2012 Early Childhood Indicators of Bryan, Carter, coal, Love & pontotoc Counties. Commissioned by ……. Big Five Community Services. Inc. Prepared by the Community Service Council June 2012. Bryan, carter, coal, love & pontotoc Counties. Demographic Trends

E N D
Community Profile 2012Early Childhood Indicators of Bryan, Carter, coal, Love & pontotoc Counties Commissioned by ……. Big Five Community Services. Inc. Prepared by the Community Service Council June 2012
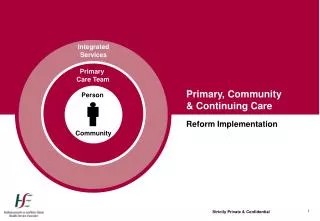
Bryan, carter, coal, love & pontotoc Counties • Demographic Trends • Economics and Employment • Child Indicators
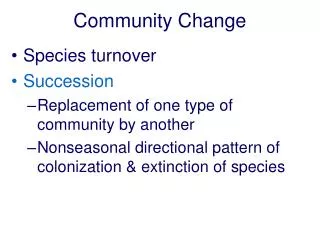
Demographic Trends • Population change--migration to suburban areas of Tulsa and Oklahoma City MSA with an overall decrease in new births • Age--aging population • Race and ethnicity--more culturally diverse • Living arrangements--transitional for family living arrangement DEMOGRAPHIC TRENDS
Comparison of self-sufficiency wage to poverty guidelines, by size of familyBryan county, 2012 ECONOMICS & EMPLOYMENT Notes: For the self-sufficiency wages shown in table, family of two consists of one adult and one preschooler; family of three consists of one adult, one preschooler and one schoolage child; family of four consists of two adults, one preschooler and one schoolage child. Hourly wages given assume full-time, year-round employment. Source: Oklahoma Association of Community Action Agencies and the Oklahoma Asset Building Coalition, December 2009, The Self-Sufficiency Standard for Oklahoma 2009; 2012 HHS Poverty Guidelines, Federal Register, Vol. 77, No. 13, January 26, 2012, p. 3637-3638. Bureau of Labor Statistics, May 2012.
Comparison of self-sufficiency wage to poverty guidelines, by size of familycarter county, 2012 ECONOMICS & EMPLOYMENT Notes: For the self-sufficiency wages shown in table, family of two consists of one adult and one preschooler; family of three consists of one adult, one preschooler and one schoolage child; family of four consists of two adults, one preschooler and one schoolage child. Hourly wages given assume full-time, year-round employment. Source: Oklahoma Association of Community Action Agencies and the Oklahoma Asset Building Coalition, December 2009, The Self-Sufficiency Standard for Oklahoma 2009; 2012 HHS Poverty Guidelines, Federal Register, Vol. 77, No. 13, January 26, 2012, p. 3637-3638. Bureau of Labor Statistics, May 2012.
Comparison of self-sufficiency wage to poverty guidelines, by size of familycoal county, 2012 ECONOMICS & EMPLOYMENT Notes: For the self-sufficiency wages shown in table, family of two consists of one adult and one preschooler; family of three consists of one adult, one preschooler and one schoolage child; family of four consists of two adults, one preschooler and one schoolage child. Hourly wages given assume full-time, year-round employment. Source: Oklahoma Association of Community Action Agencies and the Oklahoma Asset Building Coalition, December 2009, The Self-Sufficiency Standard for Oklahoma 2009; 2012 HHS Poverty Guidelines, Federal Register, Vol. 77, No. 13, January 26, 2012, p. 3637-3638. Bureau of Labor Statistics, May 2012.
Comparison of self-sufficiency wage to poverty guidelines, by size of familylove county, 2012 ECONOMICS & EMPLOYMENT Notes: For the self-sufficiency wages shown in table, family of two consists of one adult and one preschooler; family of three consists of one adult, one preschooler and one schoolage child; family of four consists of two adults, one preschooler and one schoolage child. Hourly wages given assume full-time, year-round employment. Source: Oklahoma Association of Community Action Agencies and the Oklahoma Asset Building Coalition, December 2009, The Self-Sufficiency Standard for Oklahoma 2009; 2012 HHS Poverty Guidelines, Federal Register, Vol. 77, No. 13, January 26, 2012, p. 3637-3638. Bureau of Labor Statistics, May 2012.
Comparison of self-sufficiency wage to poverty guidelines, by size of familypontotoc county, 2012 ECONOMICS & EMPLOYMENT Notes: For the self-sufficiency wages shown in table, family of two consists of one adult and one preschooler; family of three consists of one adult, one preschooler and one schoolage child; family of four consists of two adults, one preschooler and one schoolage child. Hourly wages given assume full-time, year-round employment. Source: Oklahoma Association of Community Action Agencies and the Oklahoma Asset Building Coalition, December 2009, The Self-Sufficiency Standard for Oklahoma 2009; 2012 HHS Poverty Guidelines, Federal Register, Vol. 77, No. 13, January 26, 2012, p. 3637-3638. Bureau of Labor Statistics, May 2012.
Ratio of income to poverty levelnumber of persons: total population and childrenstate of oklahoma and Bryan and carter counties, 2006-10 estimates ECONOMICS & EMPLOYMENT Note: Values shown are midpoint estimates within a 90% confidence range, which can be very wide. Estimates with margins of error exceeding +/- 10% of estimate are shown in italics. Source: US Census Bureau, 2006-10 American Community Survey.
Ratio of income to poverty levelnumber of persons: total population and childrencoal, love and pontotoc counties, 2006-10 estimates ECONOMICS & EMPLOYMENT Note: Values shown are midpoint estimates within a 90% confidence range, which can be very wide. Estimates with margins of error exceeding +/- 10% of estimate are shown in italics. Source: US Census Bureau, 2006-10 American Community Survey.
Ratio of income to poverty level total populationbryan, carter, coal, love and pontotoc counties, 1989, 1999 & 2006-10 estimates ECONOMICS & EMPLOYMENT Note: Values shown are midpoint estimates within a 90% confidence range, which can be very wide. Estimates with margins of error exceeding +/- 10% of estimate are shown in italics. Source: US Census Bureau, 2006-10 American Community Survey.
The Adverse Childhood Experiences (ACE) Study Pyramid Death CHILD INDICATORS Conception Mechanisms by which Adverse Childhood Experiences Influence Health and Well-being throughout the Lifespan Source: The Adverse Childhood Experiences Study website: www.acestudy.org, “About the Adverse Childhood Experiences Study.”