Download
1 / 52
520 likes | 612 Views
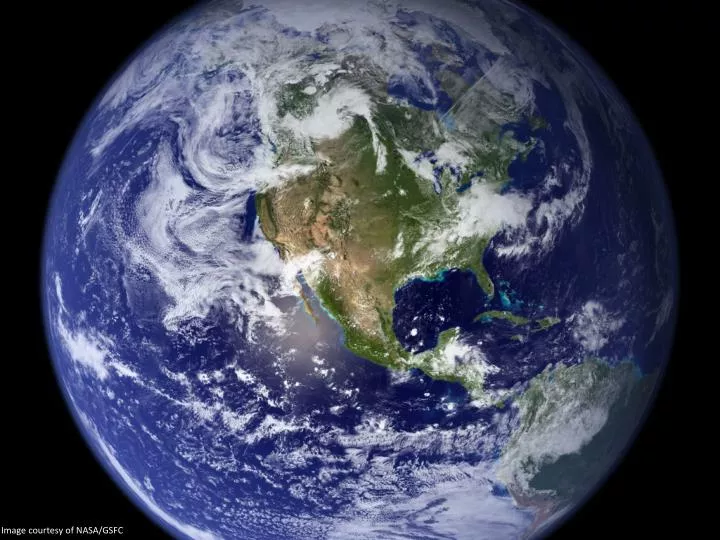
Image courtesy of NASA/GSFC. Climate Change and Farmer Adaptation in the Midwest. Eugene S. Takle Professor Department of Agronomy Department of Geological and Atmospheric Science Director, Climate Science Program Iowa State University Ames, IA 50011. World Climates Agronomy 406

E N D
Climate Change and Farmer Adaptation in the Midwest Eugene S. Takle Professor Department of Agronomy Department of Geological and Atmospheric Science Director, Climate Science Program Iowa State University Ames, IA 50011 World Climates Agronomy 406 Iowa State University 14 November 2012
Outline • Brief review of future climate scenarios as projected by climate models • Projected changes in US climate • Changes of importance to agriculture • Recent trends in Iowa’s climate and producer adaptation • What about the future: droughts or floods?
What can we expect in the future? Don Wuebbles
December-January-February Temperature Change 7.2oF 6.3oF A1B Emission Scenario 2080-2099 minus1980-1999
June-July-August Temperature Change 4.5oF 5.4oF A1B Emission Scenario 2080-2099 minus1980-1999
Increases in very high temperatures will have wide-ranging effects Higher Emissions Scenario, 2080-2099 Number of Days Over 100ºF Average: 30-60 days Recent Past, 1961-1979 Lower Emissions Scenario, 2080-2099 Average: 10-20 days Don Wuebbles
Increases in very high temperatures will have wide-ranging effects Higher Emissions Scenario, 2080-2099 Number of Days Over 100ºF Average: 30-60 days Recent Past, 1961-1979 Current Des Moines average is < 1.4 days per year over 100oF Lower Emissions Scenario, 2080-2099 Average: 10-20 days Don Wuebbles
Projected Change in Precipitation: 2081-2099 Midwest: Increasing winter and spring precipitation, with drier summers More frequent and intense periods of heavy rainfall Unstippled regions indicate reduced confidence CAUTION: High uncertainty Relative to 1960-1990 NOTE: Scale Reversed
Extreme weather events become more common • Events now considered rare will become commonplace. • Heat waves will likely become longer and more severe • Droughts are likely to become more frequent and severe in some regions • Likely increase in severe thunderstorms (and perhaps in tornadoes). • Winter storm tracks are shifting northward and the strongest storms are likely to become stronger and more frequent. Don Wuebbles
Key Messages from The 2008 USGCRP Synthesis and Assessment Product 4.3 (now being updated by the National Climate Assessment)
Projected Changes to US Agriculture • Climate changes are already affecting U.S. water resources, agriculture, land resources, and biodiversity • Climate change will continue to have significant effects on these resources over the next few decades and beyond • The life cycle of grain and oilseed crops will likely progress more rapidly • Crops will increasingly begin to experience failure • The marketable yield of many horticultural crops – e.g., tomatoes, onions, fruits – is more sensitive to climate change than grain and oilseed crops. Key Messages from the 2008 Agriculture Chapter of USGCRP SAP 4.3
Percent Changes in Crop Yield with Projected Changes in Annual Mean Temperature (not water or nutrient limited) California Central Valley Lee, J., S. DeGryze, and J. Six. 2011. Effect of climate change on field crop production in the California’s Central Valley. Climatic Change. 109(Suppl):S335-S353
Projected Yield Changes for California Crops Simulations using the DAYCENT model while ensuring water supplies and nutrients were maintained at adequate levels under low (B1) and medium-high (A2) emissions scenarios. Lee, J., S. DeGryze, and J. Six. 2011. Effect of climate change on field crop production in the California’s Central Valley. Climatic Change. 109(Suppl):S335-S353
Changes in Climate Relevant to Plant Stress A2 Climate scenario Chilling hours for fruit production Number of chilling hours is projected to rapidly decrease over the next 100 years. Trees and grapes differ in their chilling requirements: grapes: 90 peaches 225 apples 400 cherries 900
Des Moines Airport Data Caution: Not corrected for urban heat island effects
Des Moines Airport Data Caution: Not corrected for urban heat island effects
Winter Temperatures are Rising, Fewer Extreme Cold Events Des Moines Data Des Moines Data
Des Moines Airport Data 1983: 13 1988: 10 1977: 8 1974: 7
Des Moines Airport Data 1983: 13 1988: 10 1977: 8 1974: 7 6 days ≥ 100oF in 23 years
Des Moines Airport Data 1983: 13 8 days in 2012 1988: 10 1977: 8 1974: 7 6 days ≥ 100oF in 23 years
Iowa State-Wide Average Data 34.0” 10% increase 30.8”
Iowa State-Wide Average Data Totals above 40” 2 years 34.0” 10% increase 30.8”
Iowa State-Wide Average Data Totals above 40” 8 years 2 years 34.0” 10% increase 30.8”
Cedar Rapids Data 32% increase 28.0” 37.0”
Cedar Rapids Data Years with more than 40 inches 11 1 32% increase 28.0” 37.0”
“One of the clearest trends in the United States observational record is an increasing frequency and intensity of heavy precipitation events… Over the last century there was a 50% increase in the frequency of days with precipitation over 101.6 mm (four inches) in the upper midwestern U.S.; this trend is statistically significant “ Karl, T. R., J. M. Melillo, and T. C. Peterson, (eds.), 2009: Global Climate Change Impacts in the United States. Cambridge University Press, 2009, 196pp.
Cedar Rapids Data 67% increase 3.6days 6.0 days
Cedar Rapids Data Number of Years with More than 8 Occurrences 0 9 67% increase 3.6days 6.0 days
Amplification of the Seasonality of Precipitation Spring Fall Winter Summer
Amplification of the Seasonality of Precipitation Spring Fall Winter Summer
Amplification of the Seasonality of Precipitation Spring Fall 21.2 => 25.3 inches (22% increase) 12.1 => 10.5 inches (13% decrease) Winter Summer
Mean Summer (JJA) Dew-Point Temperatures for Des Moines, IA Rise of 3oF in 42 years 12% rise in water content in 42 years
Iowa Agricultural Producers are Adapting to Climate Change: • Longer growing season: plant earlier, plant longer season hybrids, harvest later • Wetter springs: larger machinery enables planting in smaller weather windows • More summer precipitation: higher planting densities for higher yields • Wetter springs and summers: more subsurface drainage tile is being installed, closer spacing, sloped surfaces • Fewer extreme heat events: higher planting densities, fewer pollination failures • Higher humidity:more spraying for pathogens favored by moist conditions. more problems with fall crop dry-down, wider bean heads for faster harvest due to shorter harvest period during the daytime. • Drier autumns:delay harvest to take advantage of natural dry-down conditions, thereby reducing fuel costs HIGHER YIELDS!! Is it genetics or climate? Likely some of each.
Iowa State-Wide Average Data Totals above 40” 8 years 2 years 34.0” 10% increase 30.8”
Iowa State-Wide Average Data Totals above 40” 8 years 2 years 5years 3years 2012? Totals below 25”
Projected Change in Growing Season Precipitation for Iowa No change GFDL CJ Anderson, ISU
Future Variability in Growing Season Precipitation for Iowa More extreme floods More extreme droughts CJ Anderson, ISU
Future Variability in Growing Season Precipitation for Iowa More extreme floods Lines drawn by eye More extreme droughts CJ Anderson, ISU