Download
1 / 30
300 likes | 552 Views
Water Quality. Burroughs Wellcome 2008 Elyse Howdershell Taylor Dozier Chudney Hill Shauntavia Sawyer. Problem Statement. What are some of the effects of runoff and sewage related pollution on the Pasquotank river watershed? What can be done to minimize the negative effects on the

E N D
Water Quality Burroughs Wellcome 2008 Elyse Howdershell Taylor Dozier Chudney Hill Shauntavia Sawyer
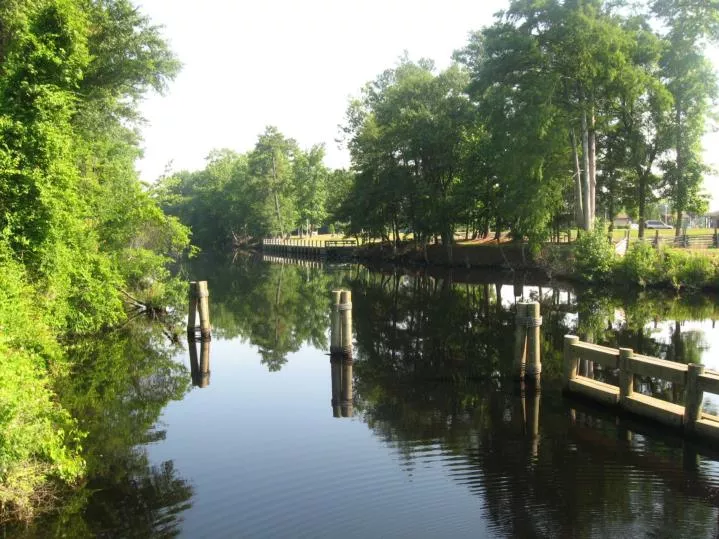
Problem Statement • What are some of the effects of runoff and sewage related pollution on the Pasquotank river watershed? • What can be done to minimize the negative effects on the water quality?
Hypothesis If samples from our sites: -Dismal Swamp (DS01) -Pasquotank River (PR02) -ECSU (ECSU03) -ECSU (ECSU04) -Currituck Sound (CS05) -show out of range levels for nitrates, phosphates, D.O., and pH, then contamination is indicated by natural or manmade pollutants. Recommendations will need to be made to mitigate these abnormal levels.
What Do We Know? • low dissolved oxygen can point to pollution • exceptionally high or low pH can point to pollution • abnormal nitrate and phosphate tests can point to pollution
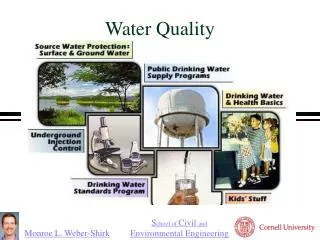
Water Quality • Water quality is made up of many different parts which include: • physical,chemical and biological characteristics • These characteristics are compared to a set of standards.
Testing for Pollution We tested our water samples for: • Nitrate • Phosphate • Dissolved Oxygen • pH (PPM- parts per million)
Our pH Results: DS01-7.22 PR02-6.6 ECSU03-6.6 ECSU04-7.21 CS05-7.84 Water with a pH value between 6.5 and 8.0 is acceptable pH Scale All of our samples showed a healthy level of pH
Yellow Springs Instrumentation (YSI) The YSI is the probe meter we used to measure dissolved oxygen and pH.
ECSU03 and CS05 showed poor health levels. Dissolved Oxygen Chart Our D.O. Results: DS01-40.3 PR02-21.37 ECSU03-4.8 ECSU04-9.00 CS05-4.09
Phosphates Total phosphate levels of non-polluted waters are usually less than 0.1mg/L or ppm. Our Phosphate Results: DS01-3ppm PR02-2ppm ECSU03-4ppm ECSU04-2ppm CS05-1ppm All of our samples showed high levels of phosphate which can indicate pollution.
Nitrates The federal standard for nitrate in drinking water is 10 mg/L All of our samples showed normal levels of nitrates
Connecting the Lithosphere to Pollution The lithosphere is the part of the earth that includes the crust and upper mantle. Fertilizers, chemicals, fecal matter, and pesticides can collect on the ground. They can be carried by precipitation into our water supplies through drains, ditches, and groundwater.
Connecting the Atmosphere to Pollution The atmosphere is the layer of gases that surrounds Earth. Polluted water can evaporate into the atmosphere, forming acid rain.
Connecting the Biosphere to pollution The Biosphere is all of the life on Earth. Chemicals are being dumped into bodies of water and affecting wild- life, SAV, and other marine life.
Connecting the Hydrosphere to Pollution The hydrosphere is the collection all of Earth's water The Pasquotank River is a part of the hydrosphere.
Contributors of Poor Water Quality • sewage overflows • humans polluting • various aquatic activities • (boating, water skiing, • swimming, etc.) • stormwater runoff • fertilizer runoff
Effects of Poor Water Quality • Polluted water is killing aquatic life • Sewage water is preventing the sunlight to reach • the sea floor • Excess nutrients, such • as lawn fertilizers, can • cause algal blooms
Sewage & Runoff • Sewage is mainly liquid fluid containing waste materials from households and industries. • Runoff is the flow of water from rain, snowmelt, and other sources over the land. It is a major component of the water cycle.
Reflection • We learned that areas of the Pasquotank watershed are contaminated by sewage and runoff. • Our research helped us understand water quality. • We researched ways to improve the water quality.
Recommendations • Planting vegetation barriers • Fund beach monitoring programs • Alternate crops • Create zones between agricultural fields • Use less hazardous waste • Planting without fertilizers.
Recommendations • Discouraging roads and development • Remove oil from parking lot runoff • ensure that septic systems are working properly • stabilize irrigation hoses
Personal Recommendations Shauntavia- I recommend that all buildings like factories as well as people stop polluting the rivers and lakes. Chudney- I recommend that we all pitch together as a community and help reduce the amount of sewage, runoff, and pollution that is going into our bodies of water.
Personal Recommendations Continued Elyse- My suggestion is to get the community involved in frequent cleaning and monitoring of local water sources. Taylor- My personal recommendation to help with pollution of our waters is to use more natural materials in fertilizers, making it less hazardous to the water quality.
We Would Like To Thank: Dr. Jim Botti Dr.William Porter Dr.Leon Pringle Dr. Thomas Rossbach Ms.Elizabeth Noble Mrs. Julie Stamper
A Special Thanks Goes To: Mrs. Marie Jenkins Mrs. Sheri Fowlkes
Reference Page • http://edf.org/article.cfm?ContentID=644 • http://www.midwestadvocates.org/assets/toxics%20large.gif • http://www.hakkoairpumps.com/images/dissolved_oxygen_ chart.gif • http://www.epa.gov/acidrain/education/site_students/images/ phscale.gif • http://www.ext.colostate.edu/PUBS/crops/00517.html • http://www.bestfish.com/tips/102998.html • www.wikipedia.com • http://www.crjc.org/new%20WR4chapter/APPENDIX%20C.RECOMMENDATIONS.pdf • http://www.grinningplanet.com/2008/01-08/water-pollution-solutions-article.htm