Download
1 / 26
260 likes | 327 Views
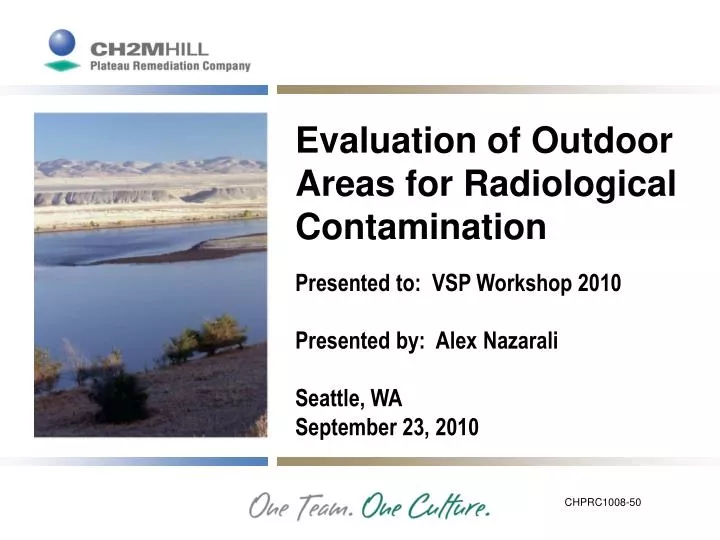
Evaluation of Outdoor Areas for Radiological Contamination. Presented to: VSP Workshop 2010 Presented by: Alex Nazarali Seattle, WA September 23, 2010. CHPRC1008-50. Acknowledgments.

E N D
Evaluation of Outdoor Areas for Radiological Contamination Presented to: VSP Workshop 2010 Presented by: Alex Nazarali Seattle, WA September 23, 2010 CHPRC1008-50
Acknowledgments Thank you to the Geographical Closure Group under the Soil & Groundwater Remediation Project for their support in putting this presentation together.
Hanford Site • Radiological Controls include posting areas based on contamination hazard for workers and equipment. • Large outdoor areas are a challenge due to size —100% survey of areas is not possible. • Need a reasonable statistically-based survey method to evaluate these areas for contamination exceeding the various posting thresholds.
Hanford Site • Soil Contamination Area posting warranted if activity is directly detectable, but is not transferable. • Contamination Area posting warranted if contamination is transferable. • No radiological posting required if activity is not directly detectable.
Combined Judgmental and Random Sampling • Visual Sample Plan contains several modules that could be applied to the posting evaluation issue. • Combined Judgmental and Random (CJR) is selected to perform the outdoor area evaluations: • Takes advantage of Radiological Control Technician experience to select judgmental sample locations. • Provides a defensible consistent method to determine the number and location of randomly located samples that ensures a high statistical confidence in the results. • CJR establishes a high confidence that a large fraction of the decision area is acceptable-provided that none of the samples are found to be unacceptable.
Combined Judgmental and Random Sampling The statistical model of the CJR methodology is based on binary outcomes, such as: • Presence or absence of a particular quality. • Sample result being acceptable or not as defined by an established action level threshold. • Contamination being detected or not detected, etc.
Assumptions CJR statistical method is based on the following assumptions and data: • A 95% confidence level. • Random samples should be taken in addition to judgmental samples. • The null hypothesis for the method is that 95% of the decision unit is less than the established action level threshold. • If the null hypothesis is proven false the decision unit fails and must be controlled based on the magnitude of the measurement.
Application • Survey results are compared against several action level thresholds such as total and removable values in 10 CFR 835 Table 2-2 to determine the indicated posting for survey unit. • When the null hypothesis is proven correct (no measurement exceeds a threshold value) no posting is required for survey unit. • When the null hypothesis is proven false, then radiological posting based on the most limiting survey result(s) measured in survey unit is warranted.
Cleanup Verification Package Parameters • The sampling design parameters used as the basis for the CJR-based default survey plan are summarized in the handout table. • Although the default survey plan calls for a maximum survey unit size of 2000 m2, the design parameters for the method below include a slightly larger sample area size. • This ensures that the number of survey locations required by the default survey plan (i.e., 28 survey locations) will meet or exceed the 95% confidence level established as the minimum criteria for the statistical model.
Cleanup Verification Package Parameters • For a survey unit size smaller than the modeled value, the total number of grid units is reduced, but the same number of grid units will be surveyed. This serves to increase confidence level for the survey to a value higher than 95% (e.g., 95.22% for a 2000 m2 survey unit).
Primary Sampling Objective • The primary objective of the sampling design in this survey unit is to combine the information obtained from judgmental samples and samples from randomly selected locations to achieve 95% confidence that at least 95% of the decision area is acceptable, provided that none of the judgmental or random samples are unacceptable.
Selected Sampling Approach • The CJR method requires that all surfaces in the survey unit be divided into non-overlapping, equal-size grid cells of specified size that correspond to the sampling methodology, i.e., 2 m by 2 m. • The size of the grid cell corresponds to the “footprint” or width of the scan survey. Direct measurements and transferable contamination measurements are performed within the selected grid cells as directed by the survey plan.
Example Survey Unit Showing Judgmental Survey Locations Key: judgmental random
Decision Rule • If all 10 judgmentally selected grid cells and 18 randomly selected grid cells are acceptable, then you will be 95% confident that at least 95% of the grid cells are acceptable. • If any of the judgmental or random samples are unacceptable, then the confidence statement above no longer applies and you must assume that at least some portion of the grid cells are unacceptable.
Output Data • n2 = 18 Number of random samples required to achieve the confidence criteria. • Given the parameter inputs provided by the user, VSP calculates the number of samples according to the following.
Output Data • The confidence, C, that at least: l x 100% of the decision area is acceptable, given that all judgmental and random samples were acceptable can be written as
Assumptions • The total number of grid cells, N, in the decision area is known and each grid cell is the same size. • The size of the grid cell is appropriate for the chosen sampling methodology. If more than one sampling methodology is employed in a decision area, the size of the grid cell is chosen to match the sampling methodology with the smallest sampling area. • The outcome from each sample will be binary, such as the presence/absence of contamination (as determined by the minimum detection levels) or acceptable/unacceptable levels of contamination (as determined by the action level).
Assumptions (continued) • The measurement (inspection) method correctly classifies each sample as acceptable or unacceptable, i.e., a grid unit which is acceptable is never classified as unacceptable (a false positive), and grid unit which is unacceptable is never classified as acceptable (a false negative). • All grid cells are independent. If spatial correlation is present, the CJR method is conservative, i.e., more samples are required than would otherwise need be.
Assumptions (continued) • In the decision area, there are n1 high risk grid cells which are more likely to be unacceptable. The remaining N – n1 grid cells are low risk cells which are less likely to be unacceptable. • All n1 high risk grid cells are sampled with judgmental samples. • A high risk cell is, on average, r times more likely to be unacceptable than a low risk cell.
Assumptions (continued) Acceptable outcomes from judgmental samples increases our confidence that low risk cells are also acceptable. Before sampling takes place, we expect the probability of a judgmental sample being acceptable to be PJ . The probability that a high risk cell is unacceptable has a Beta prior distribution with shape parameters a = 1 and b = PJ / (1 - PJ) .
Assumptions (continued) A random sample of size n2 is taken from the low risk grid cells. The sample locations may be selected using simple random, systematic random, or adaptive fill sampling.