Download
1 / 33
330 likes | 428 Views
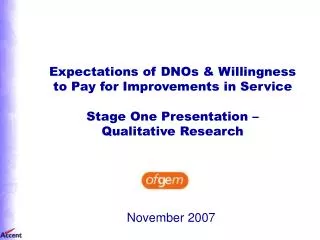
Expectations of DNOs & Willingness to Pay for Improvements in Service. May 2008. Agenda. Survey objectives Fieldwork Methodology Background findings Stated preference design & analysis Stated preference findings. The objectives were…. To determine:

E N D
Expectations of DNOs & Willingness to Pay for Improvements in Service May 2008
Agenda • Survey objectives • Fieldwork Methodology • Background findings • Stated preference design & analysis • Stated preference findings
The objectives were… To determine: • consumers’ experience and satisfaction with the quality of service they receive • areas of quality of service, environmental and social outputs that consumers value and their relative priorities amongst these • consumers’ awareness of the guaranteed standards, their views on improvements or extensions to the guaranteed standards, their relative priorities for improvements and their willingness to pay for such changes • consumers’ expectations regarding planned and unplanned interruptions to their electricity supply • consumers’ expectations regarding notification of planned interruptions and of when they can expect to be restored after unplanned interruptions to their electricity supply • consumers’ expectations regarding the resilience of their power supply to bad weather or other exceptional events and willingness to pay for improvements in this area • the extent of consumer contact with DNOs and their satisfaction with this contact • consumers’ views on variations in quality of service delivered in different geographical areas and their willingness to pay for improvements in service to worst-served consumers or consumers in rural areas • consumers’ views on the benefits of undergrounding parts of DNOs’ networks and their willingness to pay for a programme of selective undergrounding • how expectations and willingness to pay for service improvements vary: • for different consumer groups such as domestic consumers, business consumers and consumers in rural areas • for consumers within the different distribution service areas of each DNO • according to the quality of supply customers have experienced
Stage One Stage Two Qualitative Research Quantitative Research • Exploring relevant issues • Understanding how consumers think and feel • Providing necessary context for quant stage • Informing the design of the stated preference • Quantification of experiences & attitudes • Determining relative service priorities • Identifying WTP Undertaken through A Comprehensive Research Programme
The methodology consisted of… Fieldwork dates: 27 February 2008 to 6 April 2008 Fieldwork dates: 27 February 2008 to 18 April 2008
The questionnaire covered… • electricity consumption • experience of cuts • attitudinal questions about consumers’ expectations of quality of service and service standards (including voltage fluctuations for businesses) • awareness of GS2, GS2A & GS4 • stated preference exercises
Background Findings Domestic Consumers
Frequency & Duration of Unplanned Cuts FREQUENCY DURATION MEAN = 1.9 MEAN = 92 MINUTES
Frequency & Duration of Planned Cuts FREQUENCY DURATION MEAN = 1.2 MEAN = 99 MINUTES
Distributor Contact 4% had been contacted or called back by their distributor during an unplanned power cut
Do you believe it is reasonable for a power cut to occur in severe weather, ie a major storm or flooding?
Service Expectations • On average, the maximum number of cuts lasting more than 3 hours that they felt a DNO should be allowed in any one year before paying compensation was 2 (excluding 1% of extremes of 10+) • Most (79%) felt that power should be restored within 3 hours following an unplanned cut (43% said within 1 hour) • In normal conditions it was felt that a distributor should be required to pay compensation to a consumer after an average of 12 hours without power following an unplanned cut • After a major storm affecting 100,000 customers most expected power to be restored in 6 hours or less (44%); although a further two fifths (40%) felt within 24 hours was acceptable
45% felt that DNOs should be doing more to reduce the impact of severe weather on their networks Do you think that distribution companies should be doing more to reduce the impact of severe weather on their networks?
56% felt that DNOs should be taking steps to reduce their company’s impact on the environment Do you think that your distribution company should be taking any steps to reduce their company’s impact on the environment?
Background Findings Business Consumers
Size of Organisations: Small = <100KwH or <£30,000pa; Medium = 100KwH-<1MW or £30,000-£275,000pa; Large = 1MW+ or >£275,000pa
Frequency & Duration of Unplanned Cuts FREQUENCY DURATION MEAN = 2.6 MEAN = 145 MINUTES
Frequency & Duration of Planned Cuts FREQUENCY DURATION MEAN = 1.4 MEAN = 138 MINUTES
Distributor Contact 11% had been contacted or called back by their distributor during an unplanned power cut
Experience of Voltage Fluctuations • Some claimed to experience them on a daily basis (1%), but most experienced them up to 5 times a year (59%) • 35% of businesses had implemented measures, or invested in equipment, to protect the business in the event of a power dip or surge in supply • Levels of investment ranged from the odd pound to as much as £25,000,000: • Small: £45K • Medium: £33K • Large: £1.8M • Just less than one third of businesses stated that their business’s insurance covered them in the event of a loss of business as a result of a power cut: • large businesses were more likely to be covered than small businesses (39% large, 30% medium and 27% small)
Do you believe it is reasonable for a power cut to occur in severe weather, ie a major storm or flooding?
Service Expectations • On average, the maximum number of cuts lasting more than 3 hours that they felt a DNO should be allowed in any one year before paying compensation was 1.7 • Most (53%) felt that power should be restored within 1 hour following an unplanned cut (a further 30% said within 2-3 hours) • In normal conditions it was felt that a distributor should be required to pay compensation to a business after an average of 6 hours without power following an unplanned cut • After a major storm affecting 100,000 customers most expected power to be restored in 6 hours or less (34%); although a further two fifths (40%) felt within 24 hours was acceptable: • the proportion expecting restoration within 6 hours was higher amongst larger businesses (44% large, 38% medium and 31% small)
55% felt that DNOs should be doing more to reduce the impact of severe weather on their networks Do you think that distribution companies should be doing more to reduce the impact of severe weather on their networks?
71% felt that DNOs should be taking steps to reduce their company’s impact on the environment Do you think that your distribution company should be taking any steps to reduce their company’s impact on the environment? 62% would like information to be available from their DNO on how they could be more energy efficient, most via email (37%) or leaflet (25%), although 10% wanted a visit