Download
1 / 14
140 likes | 310 Views
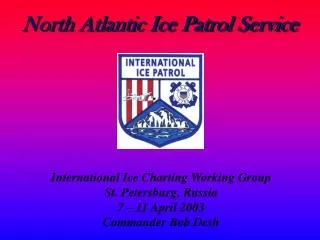
Finnish Institute of Marine Research. IICWG-4, St. Petersburg, Russia, 7-10 April 2003 / A. Seina. Finnish Ice Service. Ari Seina Finnish Ice Service. Torbjorn Grafstrom Swedish Ice Service. IceMap –

E N D
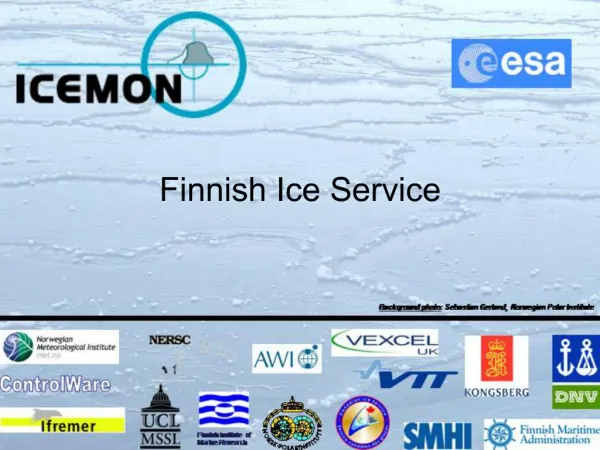
Finnish Institute of Marine Research IICWG-4, St. Petersburg, Russia, 7-10 April 2003 / A. Seina Finnish Ice Service Ari Seina Finnish Ice Service Torbjorn Grafstrom Swedish Ice Service IceMap – Collaborate ice mapping system at the Baltic Sea (Finland –Germany- Sweden)
Finnish Institute of Marine Research IICWG-4, St. Petersburg, Russia, 7-10 April 2003 / A. Seina IceMap • Developer: VTT – Technical Research Centre of Finland / Information Technology • 1994 Operational at Finnish Ice Service • 1995 Operational at Swedish Ice Service • 1996 Operational at German Ice Service Versions 1.0 /1994 1.6 /1995 1.1 /1994 1.7 /1996 1.2 /1994 1.8 /1998 1.3 /1995 1.9 /2001 1.4 /1995 ............. 1.5 /1995 3.1.3.2 /2003
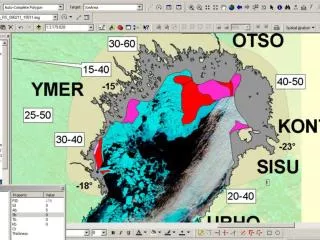
VTT TECHNICAL RESEARCH CENTRE OF FINLAND ICEMAP main features today • An interactive editing tool for creating maps using satellite images as templates • Based on polygon networks: attibutes can be assigned to areas defined as polygons. These attributes are related to the visual appearance (hatching), but also to properties like ice thickness etc. • Output formats: Postscript, Grid (attribute values at regular sampled intervals), area sizes and types per area. Other formats can be generated from the Postscript output (PDF, raster) • Possibility to read temperature measurements directly from file and plot them on the map • Isotherm generation • Tailored to the needs of the Ice services around the Baltic Sea. • Runs on a Unix workstation (HP-Unix, Digital Unix, SUN Solaris) • Implemented using C++, X-Windows, Motif • VTT Technical Research Centre of Finland/Robin Berglund
VTT TECHNICAL RESEARCH CENTRE OF FINLAND ICEMAP recent additions and future enhancement ideas • Possibility to run IceMap in batch-mode. Enables automated production of charts for separate areas and in different formats (including grid-files). Used at FIMR Ice Service. • Automatic coloring of charts according to ice polygon attributes. Experimental at this stage (waits for the color standard to be finalized) • Additional attributes for the ice polygons related to ice ridging. Enabling of dynamic addition of new attributes. • Output according to SIGRID-3 (under investigation) • Line simplification to reduce size of output file. Useful for possible transfer of vector formats over slow links. (Not implemented yet) • VTT Technical Research Centre of Finland/Robin Berglund
VTT TECHNICAL RESEARCH CENTRE OF FINLAND IceMap on Linux - licensing options • Linux-version will be prototyped in a research project (IRIS). Prototype will be made available to participants in the IRIS project (FIMR, SMHI) • Possibility to have access to the source code will be offered. Enables development of enhancements and in-house support without dependency on VTT. Conditions still to be agreed upon. • copy of corrections/improvements also sent back to VTT • for use within own organization only • VTT Technical Research Centre of Finland/Robin Berglund
Finnish Institute of Marine Research IICWG-4, St. Petersburg, Russia, 7-10 April 2003 / A. Seina
Finnish Institute of Marine Research IICWG-4, St. Petersburg, Russia, 7-10 April 2003 / A. Seina Each ice area contains: Thickness (avg.): xxx cm Thickness (min.): xxx cm Thickness (max.): xxx cm Concentration: xxx % Degree of ridging: x unit 0= no deformation 1= rafted ice 2= weakly ridged ice 3= ridged ice 4= heavily ridged ice 5= brash ice barrier • Ice forecast • SAR algorithm based products
IceMap is a part of ice service system In flow Processes Model Output product Server Manual operation Interactive operations on computer Finnish Institute of Marine Research IICWG-4, St. Petersburg, Russia, 7-10 April 2003 / A. Seina FINNISH ICE SERVICE: FLOW OF DATA AND INFORMATION PRODUCTS NOAA AVHRR Receiving & processing Format change & compression IceView: Check & adjust Sending to ships Users of all kind: -Icebreakers -Ships -Pilots -Fishermen -Coastal guard -Military -Strategic transpor-tation planning -Great public RADARSAT SAR Geometric transformation+ area cuts+ resolution decreasing+ compression Down-loading Sending to icebreakers IceView: Check & adjust SST Ground truth Automatic Classification Call-fax Ice chart ECMWF e-mail ICEMAP HIRLAM Ice drift chart Ice drift in text format Wave & gauge data Ice forecast WAM Wave forecast charts Wave forecasts in text Formats: *.pdf, *.ice, *.tiff, *.postcript, *.grid,
Architecture used in the Baltic Sea Data Provider Server Client Software Finnish Institute of Marine Research IICWG-4, St. Petersburg, Russia, 7-10 April 2003 / A. Seina
Finnish Institute of Marine Research IICWG-4, St. Petersburg, Russia, 7-10 April 2003 / A. Seina • Data to the icebreakers and ships: • IBPlott system for icebreakers • IceView for ships • An example of the icebreaker IBPlott system
Ice charts and satellite data to icebreakers and ships in digital format Finnish Ice Service
FIMR’s latest operational product to users at sea (in experimental use in 2003) Finnish Institute of Marine Research IICWG-4, St. Petersburg, Russia, 7-10 April 2003 / A. Seina Ice thickness classification Resolution ~500 x 500 m Combination of SAR image algorithms & ground truth measurements
Finnish Institute of Marine Research Finnish Institute of Marine Research IICWG-4, St. Petersburg, Russia, 7-10 April 2003 / A. Seina IICWG-4, St. Petersburg, Russia, 7-10 April 2003 / A. Seina • Future ice charting system: • IceMap • 2003 =>Linux version • 2003 => Source code to users • ArcGIS • Other possibilities ???????????????? • We have not desided the future system: • IceMap could be used for several years • Other possibilities will be studied Today: Workstations Future: PCs???
Preliminary results of the grid-point extraction from the operative IceMap icecharts (chart is 2003-02-27). Information will be submitted to GDSIDB. Data base covers 1960-2003. Remaining 2 years of Baltic Sea icedigitalization project (1980/81 and 81/82) will be finalized in summer of 2003. Torbjorn Grafstrom SMHI IICWG-4, St. Petersburg, Russia, 7-10 April 2003 IICWG-4, St. Petersburg, Russia, 7-10 April 2003 / A. Seina