Download
1 / 15
160 likes | 390 Views
Supplier Transition Procedure. Peter Dayton. Improve the Speed and Quality of Transition to New or Existing Suppliers. Project Charter to:. Opportunity Statement. Business Case.

E N D
Supplier Transition Procedure Peter Dayton
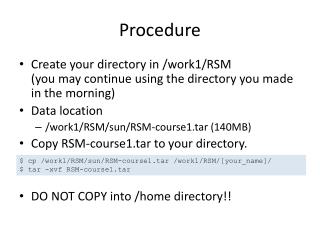
Improve the Speed and Quality of Transition to New or Existing Suppliers Project Charter to: Opportunity Statement Business Case Records indicate that transition time for a Bid lot averages 12 months or longer . Transitioning 95% of Bid “New Dollars” per plan can net ASCO a minimum of $100 K in annual Savings. Maintaining Velocity during supplier transitions provides a Competitive Advantage for ASCO. Each year outsourcing the tensioned spend saves ASCO approximately 100K per month. Goal Statement Project Scope The Goal of this project is to create an implementation methodology and process that will improve the speed and velocity of supplier transitions so that they occur effectively and within planned time frame. All activity required to Prepare for the bid event. Lotting and RFQ activity. Supplier selection, Award, Transition planning, Sample Approval and Production Delivery. Team Selection Sponsor - J. Meek BB Candidate - Ed Fox Core Team Members: Al Middeke Jim Sorrentino Bill McDaniels Rich Connolly Dave Zdobinski Project Plan
Pre Event - Transition Activity In 2007 voting by Asia team, 85% of priority on Pre Event Planning. Drawings, procedures, CTQ’s and involvement
Bid Event to Award, FA & Production in Days 55% of Samples rejected by QA, Engineering review drops it to 34 % Re-Submit
Confidence Interval - Transition Timeline Shortest Predicted Longest Predicted
Key Elements of New Process PUR - 010 • Process Map – Current State • Model of Transition Timeline • Engineering Involvement (Rationalize/Obsolete/Process Changes • Drawing and Specification Review Criteria – (ECR as Req’d) • Reserve Price Calculation (For Die Cast Pilot event 11.5%) • RFQ (CTQ’s) Critical to Quote • First Article Decision Guide • Cross Functional Pre Bid Meeting • Cross Functional Post Bid Review and Award • Technical Review with Award Winner Mandatory • Integrated Transition Tracker
What Has Improved ? • Closer tracking of NCDR process • Increased cross functional support • Pre-bid part selection has better screening • Print review process improving • Events no longer open for 2 years • Gauging decisions earlier in the process • Commodity and Supplier Managers are focusing on transitions • Improved communication with incumbent if they lose • Upfront technical discussion with award winners
Improvements for FY08 • Transition progress reporting • Reduce slippage in schedules; Communicate regularly • Phase checklists • Insure steps are being followed • Establish rules for other types of transitions • Past focus had solely been on ES events • Continued improvements to tracking software • Training the Team, not just Procurement