Download
1 / 53
530 likes | 609 Views
2. Fish and climate. The forecasts are based on models. The famous "hockey stick". IPCC, 2001. Climate Gate?.

E N D
The famous "hockey stick" IPCC, 2001
“.. a new form of colonialism...The white wealthy western world telling 1.6 billion people in developing world -- predominantly of color -- that they have to have their economies managed, their energy managed all because of climate fears."
http://www.weeklystandard.com/articles/denial http://joannenova.com.au/2009/12/new-scientist-becomes-non-scientist/
THE world’s leading climate change body has been accused of losing credibility after a damning report into its research practices. A high-level inquiry by the InterAcademy Council (IAC) into the Intergovernmental Panel on Climate Change found there was “little evidence” for its claims about global warming. It also said the panel had emphasised the negative impacts of climate change and made “substantive findings” based on little proof.
Global temperature trends: NASA, 1998 for the last 1,000 years … for the last 10,000 years … It seems as if temperatures have always been changing! for the last 1,000,000 years …
NIPCC Non-governmental International Panel on Climate Change March 2008 Available on line from www.heartland.org Follow the debate: See http://www.climatedepot.com/
Environmental changes What are the fishery, environmental, and trophic effects in historical data? Can we use ‘short-term’ predictions from multiple regression models? Two kind of predictions: • What happens when? • What happens if? IPCC 2001, Box 6-1
Normalised catches of 11 commercial fish species (accounting for about 40% of the world’s marine catch) have fluctuated together over the20th century. Catches also show a strong relationship with the Atmospheric Circulation Index (ACI).ACI is a large-scale, multi-decadal climatic index based on the direction of atmospheric air mass transfer.Adapted from Klyashtorin (2001) IGBP Science Series,“Marine Ecosystems and Global Change http://ioc.unesco.org
Global ecosystem Includes atmosphere, lithosphere biosphere Modified from Karl et al. (2003)
Artist: Glynn Gorick Iverson (1990) All biological production in the sea depends on plankton
Regional Climatology Affects Ecosystems The Northern Atlantic Oscillation index (NAO)
The Northern Atlantic Oscillation The Atlantic Multidecal Oscillations (AMO) Sutton and Hodson(2005)
North sea changes Trends in the abundance of Calanus finmarchicus from Continuous Plankton Recorder Survey (CPR) data. Annual mean biomass (mg C m-3) in the upper 10m, and as a proportion of the biomass of species representing all omnivorous zooplankton. http://www.igbp.kva.se/documents/recources/NL_47.pdf
Changes in species composition between a cold water and warm water temperate copepod species in the North sea.
Climate (NAO) influence biology r2 = 0.58 Relationship between annual abundance of Calanus finmarchicus from CPR Surveys and the winter NAO index 1958-1955 in the North Sea. Blue triangles are from when the relationship broke down in the late 1990s. Redrawn in Skjoldal (2004) after Reid and Beaugrand (2002)
Spawning stock biomass (SSB) of Norwegian spring-spawning herring and the long term-averaged temperature (the AMO signal) Toresen og Østvedt (2000)
El Niño-Southern Oscillation Historical sea surface temperature index (ENSO) El Niño and La Niña events are characterized by warmer or cooler than average sea surface temperatures in the tropical Pacific. They are also associated with changes in wind, pressure, and rainfall patterns. Once developed, El Niño and La Niña events are known to shift the seasonal temperature and precipitation patterns in many different regions of the world, even ones that are distant from the equatorial Pacific Ocean. For publications on ENSO and fisheries see: http://www.coaps.fsu.edu/lib/elninobib/fisheries/
El Niño Comparison of El Niño conditions (left) with normal conditions (right). http://coastwatch.noaa.gov/images/Sea_Surface_Temperature.ppt
Pacific Decadal Oscillations (PDO) index and modeled primary production (integrated from the surface to 120m) between 1962 and 2000. During the negative PDO, before 1978, the equatorial Pacific was cooler and primary productivity was higher. Throughout the 1980s and 1990s, the PDO was in the positive phase and, therefore, productivity in general was lower. http://www.ncsu.edu/kenan/ncsi/Docs/Presentations/Duke2.ppt
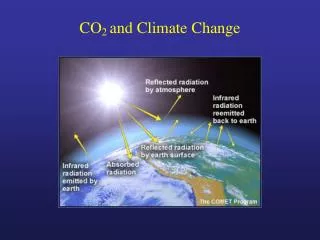
Climate change Time series of departures from the 1961 to 1990 base period for an annual mean global temperature of 14.0°C (bars) and for a carbon dioxide mean of 334 ppmv (solid curve) during the base period. From Karl et al. (2003)
Present level Present level
Historical data examined shows changes in the ocean heat content (to depths of 3000 m) to be slowly increasing with substantial decadal time scale variations related to climate variability. Levitus et al (Science, 1999)
Cod Recruitment and Temperature Warm Temperatures increases Recruitment Warm Temperatures decreases Recruitment 7 6 8 4 9 Recruits 10 3 Temp Mean Annual Bottom Temperature 11 2 Planque and Fredou (1999) From Drinkwater (2004)
Cod Recruitment and Temperature If BT < 5° and T warms stock recruitment generally increase If BT between 5° and 8.5°C little change in recruitment If BT >8.5°C recruitment generally decreases If BT ≥ 12°C we do not see any cod stocks Drinkwater (2004)
Cod landings at Greenland http://www.ices.dk/globec/data/presentations/Climate%20change%20and%20fisheries.ppt#267,6,Cod landings at Greenland
North sea Examples of North Sea fish that have moved north with climatic warming. Relationships between mean latitude and 5-year running mean winter bottom temperature for (A) cod, (B) anglerfish, and (C) snake blenny. In (D), ranges of shifts in mean latitude are shown. Bars on the map illustrate only shift ranges of mean latitudes, not longitudes. From Perry et al. (2005)
Annual landings of sole in the Kattegat-Skagerrak (ICES Division IIIA).
Sea level changes http://www.ipcc.ch/present/cop7/part2.ppt
Coral bleaching • Biologically little is known, but there seems to be a correlation between sea temperatures and coral bleaching. A. Coral showing normally pigmented regions and bleached regions to the upper side more sunlit side of colony. B. Coral in shallows showing similar pattern. Photographer: O. Hoegh-Guldberg.
Coral bleaching Regions where major coral reef bleaching events have taken place during the past 15 years. Yellow spots indicate major bleaching events. http://www.marinebiology.org/coralbleaching.htm
Distribution of coral bleaching events in 1998 www.duke.edu/web/nicholas/bio217/aer9/causes.htm
Coral bleaching Weekly sea surface temperature data for Tahiti (149.5oW 17.5oS). Arrows indicate bleaching events reported in the literature. Horizontal line indicates the minimum temperature above which bleaching events occur (threshold temperature). Hoegh-Guldberg (1999)
Coral bleaching Number of reef provinces bleaching since 1979. Hoegh-Guldberg (1999)
Predictions McWilliams et al 2005. Ecology. 86(8) • IPCC predicts a 1-2°C rise in SST with doubling of CO2 • • McWilliams et al. predicts 100% bleaching of coral colonies in the Caribbean with a rise in SST of only 0.85°C
Final comments • Future climate changes are expected • Impact on fish production unknown • Individual stocks may change in abundance locally • If stock increases the cause will be attributed to ‘environment’ • If the stock decrease the cause will be attributed to ‘overfishing’ and/or ‘climate change’
Time for fighting climate change? Thank you! Record Heat Record Ice Melt Record Coral Bleaching Record Hurricane season Record Droughts